


🔑 Register an account with Gate.io
👨💼 Complete KYC within 24 hours
🎁 Claim Points Rewards
Your Gateway to crypto news and insights
[TL; DR]
Gerald Appel developed the moving average convergence divergence indicator (MACD) in 1979.
Many traders use the MACD indicator because of its simplicity, flexibility and reliability.
The MACD indicator shows the relationship between the moving averages of an asset such as cryptocurrency.
Traders can use the MACD indicator in crypto, stock, commodities and forex markets.
Introduction
Astute chartists include technical analysis indicators in their trading tool sets to identify trends and changes in momentum. So far, we have covered several trading indicators we find at Gate.io such as Stochastic Oscillator, Bollinger Bands, Fibonacci retracement, Klinger Oscillator and OBV. This article covers one of the widely used technical analysis indicators, the MACD.
What is MACD?
The Moving Average Convergence Divergence indicator (MACD), created by Gerald Appel, in the 1970s, is a leading momentum indicator used within the stock market and cryptocurrency sector. As a trend indicator, it establishes whether the cryptocurrency is in an uptrend or downtrend. These indications help traders to identify trading opportunities.
Individuals or appropriate software use price data to establish time series that reflect the asset’s price movements. Since it is a visual representation of this data; the MACD creates a pictorial view of the direction the price of an asset is taking.
How the MACD works
The MACD consists of three lines and a histogram that reflect the asset’s trend and its momentum. These lines are the slow moving average line and the fast moving average moving line.We also use a centre line, sometimes called the zero line. The MACD is the difference between the fast moving EMA and slow moving EMA. The 12-day EMA is the fast moving line while the 26-day EMA is the slow moving one.
As an example, if the value of the 12-day EMA is 5,151.89 and that of the 26-EMA is 4, 552.42, then the MACD is 599.47. Now, we want to understand what EMA is. Basically, EMA stands for exponential moving average. This is a method of calculating the average of the daily closing prices of an asset where we give more weights to the most recent figures of the series.
In a normal sense, a moving average is a line constructed using the average values of data generated within a predefined period, say 12 or 26 days. Since a moving average is a series of a specific number of values, as more figures are generated the earlier ones are discarded. In fact, if we are using daily figures, it means that when a new value is added, the first one in the series is dropped.
The fast moving average line is based on a short period, such as 12 days. On the other hand, we calculate the slow moving average using longer periods, like 26 days. The slow moving average represents the most recent price action while the fast moving one is indicative of the longer term price action.
We use the differences between the fast moving averages and slow moving one to plot the MACD line. It is worth noting that the slower moving line is also called the signal line.
The other component of the MACD indicator is the histogram, which is the difference between the values of the MACD line and the signal line. The following diagram shows the three major components of the MACD indicator.
Source: Cryptotrading
As we observe, on the histogram there are times when the value is zero.This is because at such points the value of the signal line and the MACD line are equal. This occurs when there are crossovers between them.
How to use the MACD
There are several ways we can use the MACD. However, what each individual opts to use depends on personal preference. First, we anticipate price behaviour by analyzing the movements of the signal line, the MACD and the fluctuation of the histogram.
MACD crossovers
For instance, the MACD line, the signal line and the histogram oscillate around the centre line, thereby generating the buy and sell signals. For instance, when the signal line and MACD line cross the centreline, a trader can enter or exit a trade depending on the type of crossover.
If the MACD line rises above the signal line it is a bullish crossover. In other words, after a confirmation a trader can enter a trade. On the contrary, if the MACD line crosses below the signal line, it is a bearish crossover. Therefore, upon getting a confirmation a trader can exit the trade.

Source: Commoditycom
Similarly, when the MACD line is above the zero line it shows bullish momentum. If it is below the line it is a bearish signal.
Oversold and overbought market conditions
We can also use the MACD line to denote the oversold and overbought market conditions. Since the MACD line fluctuates, traders can use it to gauge the market’s overbought and oversold conditions.
It is important to note that the indicator has no upper and lower limits. However, basing on the previous oscillations, traders can estimate the overbought and oversold conditions using the previous highs and lows. When the MACD line reaches the estimated highest level noticed before, it is an overbought condition, signifying a potential downward price reversal. This acts as a sell signal.
On the other hand, if the MACD line reaches the lowest possible level, we assume that the asset is in an oversold position. In this case, a trader can enter a trade position in anticipation of an upward trend reversal. However, in both cases we require confirmation.
MACD divergence and convergence
There is a divergence if the price of an asset is moving in the opposite direction as the MACD line. The divergence indicates a possible reversal of the current price trend.
MACD bullish divergence
A bullish divergence occurs when the price of the asset makes a lower low while the indicator registers a higher low. This indicates that the momentum of downtrend is weakening, signalling a possible upward trend reversal. As such, this is a buy signal.

Source: Theoptionguide
MACD bearish divergence
This occurs when the price of a cryptocurrency makes a higher high while the indicator records a lower high. This is a sign that the uptrend momentum is weakening, creating a possibility of a downward price reversal. In this respect, this is a sell signal.

Source: Theoptionguide
Using the MACD on Gate.io
Like other top trading platforms, Gate.io is well equipped with the best indicators, which include Klinger Oscillator, Fibonacci Retracement and RSI. To start using the MACD indicator, simply click “MACD” you find below the chart.

Source: Gate.io
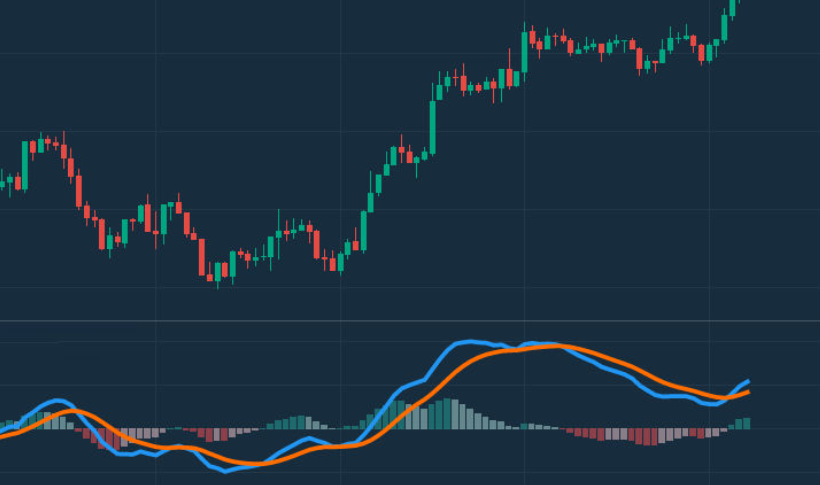
With that, the MACD will appear at the bottom of all your trading charts as indicated in the next diagram.

Source: Gate.io
Conclusion
The MACD is a very reliable trading indicator used in stock and crypto markets. It shows emerging trends and their momentum. Traders can use MACD alongside other indicators such as Bollinger Bands, Klinger Oscillator and Price Volume Trend Indicator to get the best price signal.
Author: Mashell C., Gate.io Researcher
This article represents only the views of the researcher and does not constitute any investment suggestions.
Gate.io reserves all rights to this article. Reposting of the article will be permitted provided Gate.io is referenced. In all cases, legal action will be taken due to copyright infringement.
🔑 Register an account with Gate.io
👨💼 Complete KYC within 24 hours
🎁 Claim Points Rewards
