


🔑 Register an account with Gate.io
👨💼 Complete KYC within 24 hours
🎁 Claim Points Rewards
Your Gateway to crypto news and insights

The Bollinger bands is a technical analysis tool that measures price volatility of investment instruments.
It comprises three lines namely simple moving average, the upper and lower bands.
The bollinger bands also indicate overbought and oversold market conditions.
Crypto traders should use the bollinger bands because prices of cryptocurrencies are highly volatile.
The Bollinger bands (BB) is one of the trading indicators that helps traders to predict future price movements and patterns. It also enables traders to evaluate current price trends of assets. Although traditionally people used Bollinger Bands to evaluate the price movements of legacy financial instruments such as stocks, indices and commodities, we also use them when trading cryptocurrencies.
What are Bollinger Bands?
The Bollinger Bands is a trading indicator comprising three lines that form a channel which measures price volatility of investment assets. A financial analyst and trader, John Bollinger, created this trading tool during the 1980s.

Source: Brokerxplorer
Apart from measuring price volatility , the Bollinger Bands also indicate overbought and oversold market conditions. In this sense, volatility refers to how sudden and how much the price of an asset changes within a period.
An asset is overbought when there is too much liquidity in the market to the extent of triggering a sell off. This state comes about due to the investors’ continued investment in the asset. In other words, an asset is overbought when it is trading above its fair market value.
On the contrary, an asset is oversold when its current market price is lower than its fair market price. This means that the asset is undervalued due to low liquidity in the market. When an asset is oversold, its price is likely to increase in the near future.
Components of the Bollinger Bands
The Bollinger Bands comprises three lines namely the middle line, upper line and lower line. At times, people refer to these lines as bands.
The middle line is the Simple Moving Average (SMA). On the other hand, the upper line is two standard deviations above the simple moving line (SMA) while the lower one is 2 standard deviations below it.
Standard deviation
It is important to understand what standard deviation is in order to appreciate the essence of the concept. In short, standard deviation is a measure of the spread of certain figures of a set. It shows how far a number is from the average. With the Bollinger Bands, we measure the spread from the simple moving average.
Although, two standard deviations is the default, each trader can change. For example, one can use three standard deviations since it increases the spread of the figures.
One standard deviation means that the bands cover 68% of the price moves within a period. Two standard deviations increase the spread as it covers 95% of the price moves within a period, say 4 hours. And three standard deviations encompass 99.7% of the figures.
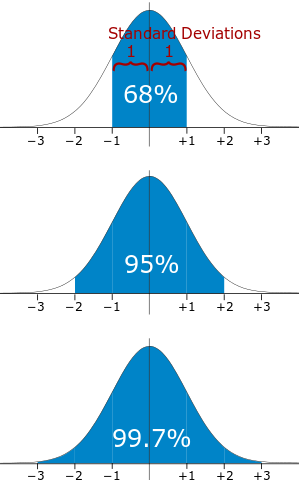
Source: Babypips
Therefore, by increasing the standard deviation you capture more figures.
Overbought and oversold market conditions of an asset

The movements of each of these three lines depends on the market conditions of an asset. Each of them can move up or down, contracting or expanding the bands. If the price moves above the moving average, towards the upper line, the asset is in an overbought market condition. Notably, the upper line may also act as a resistance line. Therefore, in most cases when the price reaches it, it bounces back.
When the price moves below the moving average and pushes towards the lower line, the asset gets into an oversold market condition.
Measuring volatility
Generally, the price line oscillates between the lower and upper bands. This may result in expansion or contraction of the gap between the lines. When the distance between the bands decreases it means that the price volatility of the asset is low. However, if the distance increases it indicates an increase in its price volatility. We call these expansion and contraction phases of the bollinger bands.

Source: Gate.io
A trader can identify the points on the graph when the price volatility of the asset is low and when it is high. For example, the price volatility was high at point B and low at point A.
How to use the Bollinger Bands when trading
It is important to note that most reliable crypto exchanges such as Gate.io have a variety of trading indicators including the bollinger bands. At Gate.io, it is simple to use bollinger bands since you simply click the relevant abbreviation. In this case, it is BOLL, as indicated in the graph below.

Once you click it, it shows on the chart.You do not need to make any calculations. All you have to do is to interpret it accordingly as we discussed above.
Bollinger bands bounce occurs when the price line touches the upper band and retraces back to the moving average.In this case, the bounce acts as a trend reversal indicator. Therefore, once the price line touches the upper line and bounces back, a trader can go short. The following diagram indicates the price movement after a bounce.

Bollinger Squeeze
When the bollinger bands contract it means that there is low volatility in the market which can trigger a price reversal action. If the price breaks upwards, you should go long because there is a high possibility for the bullish pressure to continue. If the price breaks downwards, the trader goes short.
The diagram shows a bollinger squeeze before the price shoots up.
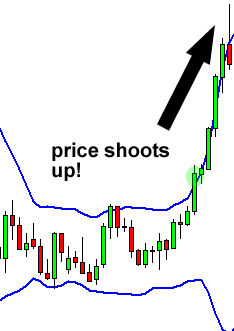
Source: Babypips
Trading double bottoms
Apart from breakouts, you can also trade double bottoms and double tops.
W-bottom
First, the price falls down to touch or go below the lower band. From there it rises till it is close to the moving average before it moves down and closes near the lower band. This pattern shows that the buyers have overpowered the sellers. From there, the price is likely to thrust upwards.

Source: Schwab
Therefore, the traders should go long as they expect the bullish pressure to continue.
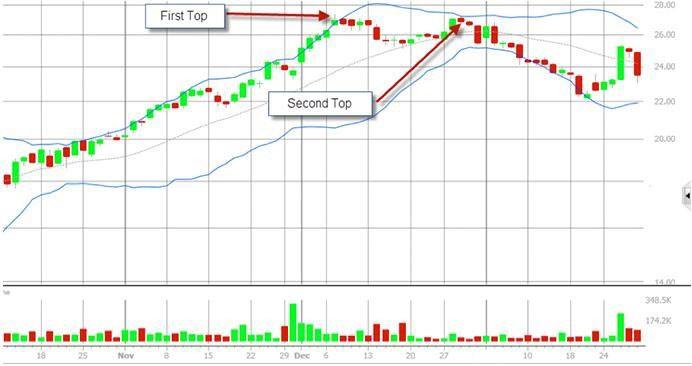
M-Top
With the M-top, the price pushes high to touch the upper band or slightly crosses it. From there, it falls down to touch the middle line before it rises up again to close near or touch the upper band.

Source: Schwab
At that point most traders sell off their assets due to an impending downward reversal.
Limitations
The major limitation is that the bollinger bands are a lagging indicator. What this means is that they react to the price movements that have already occured. In order to overcome its limitations, the developer of bollinger bands recommends that the traders should use it along with other three non-correlated tools such as support and resistance as well as candlesticks.
Conclusion
The bollinger bands measure price volatility of assets as well as indicating oversold or overbought market conditions. As such, they help to predict price reversals. The bollinger bands comprise three lines, the middle one being a simple moving average (SMA). Traders can use this indicator to spot trade exit or entry points.
Author: Mashell C., Gate.io Researcher
This article represents only the views of the researcher and does not constitute any investment suggestions.
Gate.io reserves all rights to this article. Reposting of the article will be permitted provided Gate.io is referenced. In all cases, legal action will be taken due to copyright infringement.
🔑 Register an account with Gate.io
👨💼 Complete KYC within 24 hours
🎁 Claim Points Rewards
