

Celestia
TIA
$10.05
Celestia (TIA) Price Trends
Time period | Change amount | % Change |
|---|---|---|
1H | $-0.03000 | -0.34% |
24H | $-0.5800 | -5.44% |
7D | $-1.03 | -9.33% |
30D | $-3.86 | -27.76% |
1Y | $+7.95 | +378.54% |
Credibility Indicators
70.36
Reliability Score
Rank #1
# 2025
Percentile
TOP 15%
Team Members
Mustafa Al-Bassam
CEO,Co-Founder
Ismail Khoffi
CTO,Co-Founder
John Adler
CRO,Co-Founder
Nick White
COO
Investors
Polychain Capital
Binance Labs
Coinbase Ventures
The Spartan Group
Balaji Srinivasan
Galaxy
Blockchain Capital
Delphi Digital
Live Celestia (TIA) Price Update
Celestia price today is $10.05 with a 24-hour trading volume of $76.84 M, and as such Celestia has a market cap of $1.77 B, giving it a market dominance of 0.28%. The Celestia price moved -5.44% in the last 24 hours.
Celestia reached its highest price on 2024-02-10 when it was trading at its all-time high of $20.85, while its lowest price was recorded on 2023-10-31 when it was trading at its all-time low of $2.08. The current lowest price since the last cycle high was $2.08, and the highest price since the last cycle low was $20.85. The social sentiment of Celestia is currently Positive.
The current circulating supply of Celestia is $176.55 M TIA. In terms of market cap, Celestia is currently ranked 81.
About Celestia (TIA)
FAQs
1. What determines the price movement of Celestia?
There are two schools of thought in determining the price of Celestia.
By way of intrinsic value: This typically involves on-chain metrics, project metrics and financial metrics of Celestia, collectively known as fundamental analysis. The law of supply and demand, tokenomics, use case, project roadmap as well as regulations and governance involved would affect the value of Celestia from a long term perspective.
By way of price action: Primarily analyzed via candlestick chart patterns and technical indicators such as MACD, RSI and the bollinger bands, technical analysis forecasts the price of Celestia on the basis that history tends to repeat itself. As the candlestick charts are a general representation of the emotion of the market, news announcements and community sentiment can be significant price action drivers for Celestia as well.
Investors tend to prefer the long term nature of fundamental analysis, whereas short term traders tend to rely on technical analysis more. In reality, both analyses may combine and create interesting scenarios for Celestia and the cryptocurrency market as a whole.
2. What is the highest price of Celestia price in history?
3. What is the lowest price of Celestia price in history?
4. What is the current market cap of Celestia?
5. How many Celestias are there in the market?
6. What is the maximum supply of Celestia?
7. What is the fully diluted market cap (or FDV) of Celestia?
8. What is the price prediction of Celestia in the near future?
9. Is Celestia a good investment?
10. How to buy Celestia?
Celestia Tokenomics
Next Unlock Events
Next Unlock Events
TIA 58.08M
(5.61% Total Supply)
$583.59 M
(32.90% Market Cap)
Unlock Rounds 1
187
D
2024/10/31
Unlock Rounds 1
187
D
2024/10/31
TIA 58.08M
(5.61% Total Supply)
$583.59 M
(32.90% Market Cap)
Vesting Info
Links to official documents
Allocations
Name | Total | Unlocked | Locked |
|---|---|---|---|
R&D & Ecosystem | 26.8% | 6.7% | 20.1% |
Series A&B | 19.7% | -- | -- |
Initial Core Contributors | 17.6% | -- | -- |
Seed | 15.9% | -- | -- |
Future Initiatives | 12.6% | 12.6% | -- |
Genesis Drop & Incentivized Testnet | 7.4% | 7.4% | -- |
Vesting Info
Links to official documents
Vesting Schedule
Celestia Analysis
Celestia (TIA) News

What is Celestia (TIA)? The Coin Created by a CIA Hacker Spikes 800%
A modular blockchain with a notorious founder is the new obsession among crypto enthusiasts, its token value up 40% since December 18.

Celestia’s TIA Token Pops 22% as Staking, ‘Modular’ Narrative Gains Favor
Staking TIA on native platforms is yielding between 15% to 17%, minus fees, to users, boosting demand for the cryptocurrency.

Celestia Rival Avail Inks Agreement With Starkware as Blockchain Data Race Heats Up
Avail's new "data availability" solution, currently in testing, and Madara, which is Starkware's sequencer, are both expected to go live in early 2024. They might be used in conjunction to create new application chains or "appchains."
Celestia, Blockchain Data Solution, Sees TIA Token Surge as Polygon Plan Announced
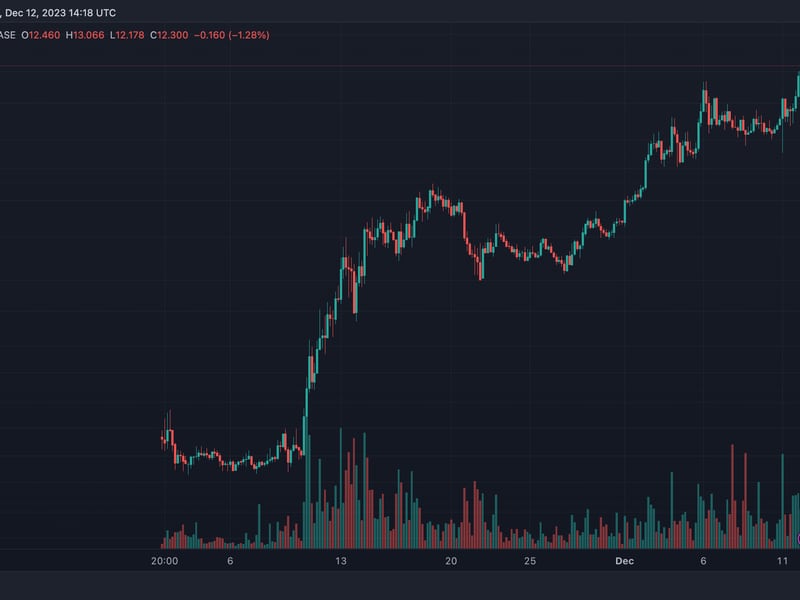
Celestia's native TIA token jumped to a record high of $12.35 on Tuesday as holders attempt to farm a series of Celestia-based token airdrops.

Polygon to Offer Data Solution Celestia as Option for New Layer-2 Developers
The integration means that Celestia will plug into Polygon’s customizable software stack, which is powered by zero-knowledge technology, allowing developers to make use of the data availability solution when launching their own blockchain.

Celestia's TIA Token Rises 200% Since Debut Despite Muted On-Chain Activity
Newly-launched modular blockchain Celestia has experienced a slow start in terms of on-chain activity, but that hasn't reduced the appetite of traders who have spurred a speculative rally to $6.30, 200% higher than when it debuted at around $2.10 two weeks ago.
Date | Market Cap | Volume | Open | Close |
|---|---|---|---|---|
2024-04-27 | $1.81 B | 7.78 M TIA | $10.06 | N/A |
2024-04-26 | $1.9 B | 8.43 M TIA | $10.55 | $10.06 |
2024-04-25 | $1.96 B | 11.19 M TIA | $10.93 | $10.55 |
2024-04-24 | $2.05 B | -- TIA | $11.62 | $10.93 |
2024-04-23 | $2.05 B | 30948.85 TIA | $11.62 | $11.62 |
2024-04-22 | $2.05 B | 10.79 M TIA | $11.47 | $11.62 |
2024-04-21 | $2.14 B | 14.97 M TIA | $11.97 | $11.47 |
2024-04-20 | $1.97 B | 20.52 M TIA | $11.03 | $11.97 |