


🔑 Register an account with Gate.io
👨💼 Complete KYC within 24 hours
🎁 Claim Points Rewards
Your Gateway to crypto news and insights
Gate.io AMA - More Details About Candlesticks, Part 1,Oct.26th
Q: Today let's talk about more details about candlesticks.
A: Let's go through it.
Elements of a Candlestick Pattern
1).Complexity
2).Type
Three types of patterns
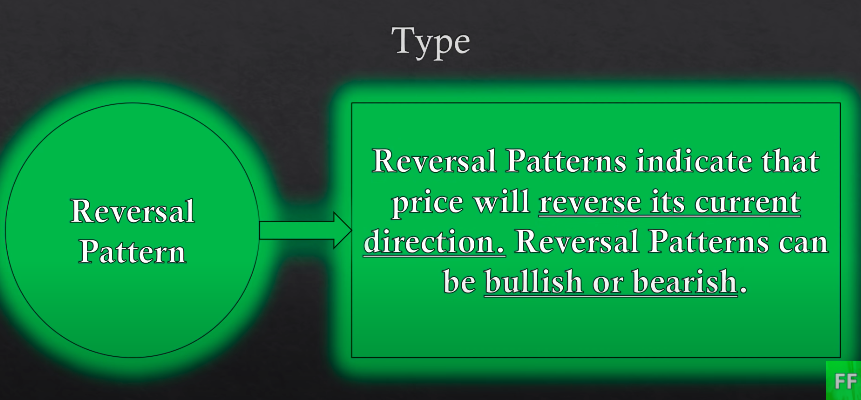
1).Reversal Patterns
2).Continuation Patterns
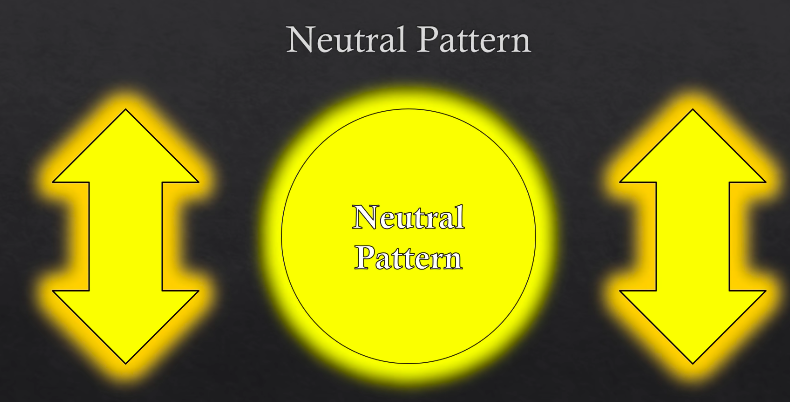
3).Neutral Patterns
1.Reversal pattern
Reversal pattern shows the pattern is going to be changed, either up or down.
There are two reversal patterns:
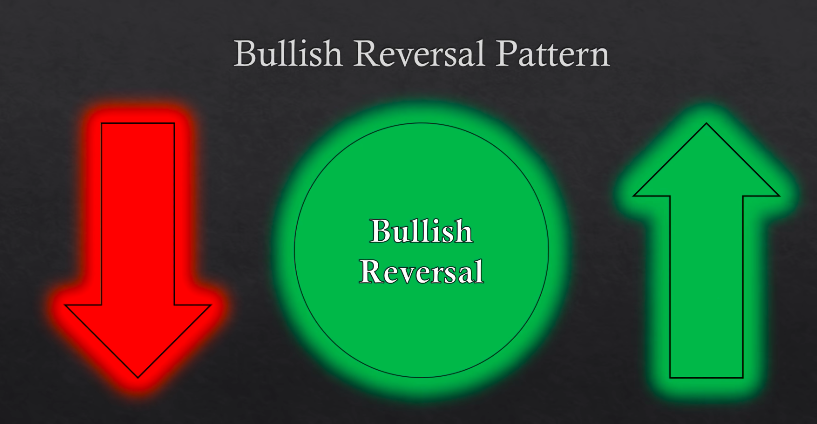
1).Bullish Reversal
2).Bearish Reversal
Bullish Reversal
Bullish reversal pattern shows the pattern is going to changed to go uptrend.
Bearish Reversal
Bearish reversal pattern shows the pattern is going to be changed to down trend.
2.Continuation Patterns
Continuation pattern shows the trend is under certain situation continually.
Bullish Continuation Pattern
Bullish continuation pattern shows the price is continually going up instead of reversing to another side.
Bearish Continuation Pattern
Bearish continuation pattern shows the price is continually going down instead of reversing to another side.
3.Neutral Patterns
Neutral pattern shows the trend is not very clearly to a certain direction, under the adjustment.
1).Neutral pattern shows the price is not going up or down, in the situation of adjustment and need to wait for the timing of the change.
2).Neutral pattern doesn't indicate the market is going up or down.
Summary
1.Reversal patterns indicate the price is going in a reversed direction.
2.Continuation patterns indicate the price is continually going in a current direction.
3.Neutral patterns don't indicate the future trend.
Q: Can you tell me how to specify the patterns?
A: The patterns of candlesticks can be simple or complex.
The way we study the patterns:
Name+Classifcation
1).Hammer is Simple Bullish Reversal Pattern
2).Doji is a Simple Neutral Pattern.
Q: What is the key point to study Candletsicks?
A: Most important
Learning the logic behind each candlestick pattern is MUCH MORE IMPORTANT than learning the names and classifications.
Q: How about let's look into the details?
A: It is ok, let's go to Neutral Pattern.
Neutral Pattern
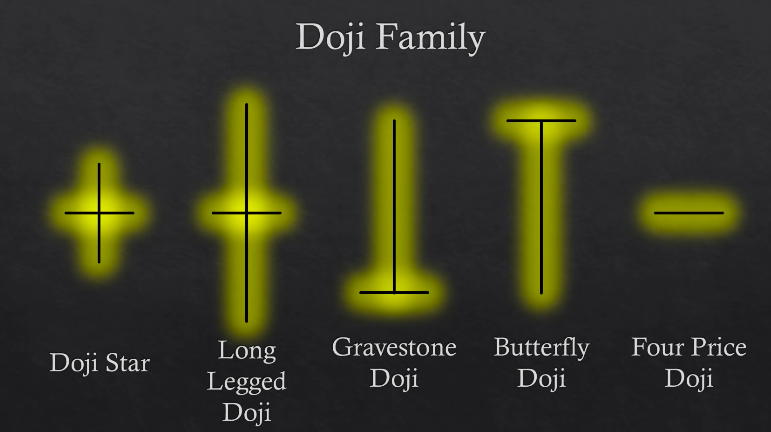
1.Doji, the shape as following without candle bodies, shows the trend is neutral. Which means the power of BUY and SELL are fighting each other and then no winner to cause the change.
2.Below are Doji family with 5 shapes.
Doji star
1.Long legged Doji
2.Gravestone Doji
3.Butterfly Doji
4.Four Price Doji
Let's go to these shapes one by one.
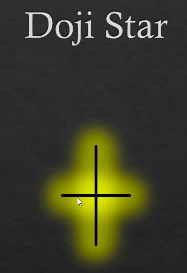
1.Doji star
1).From the picture as following, the tails of fours sides are equivalent, which means the buyers and sellers were fighting but there's no winner, so there's no change for future market.
2).It is a totally the neutral pattern.
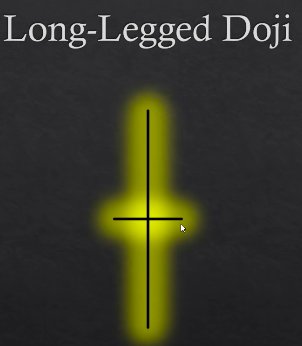
2.Long legged Doji
1).From the picture as following, the tails of up and low are equivalent, but longer than Doji star. Which means the buyers and sellers were fighting more heated than Doji star, but there still no change for future market.
2).It is still the neutral pattern.
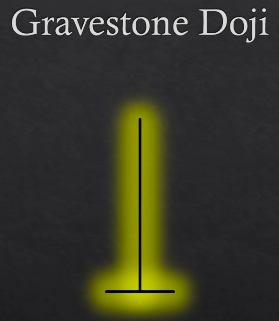
3.Gravestone Doji
1).From the following picture, the uppertail is obviously very long, the low tail is non-existent.
2).The open and closed prices are the same as shown in the picture.
3).It is also the neutral pattern as the price is not showing any trend to go up or down.
4.Butterfly Doji
1).It is a totally reversed Doji shape from Gravestone Doji.
2).From the following picture, the lowertail is obviously very long, the uppertail is non-existent.
3).The open and closed prices are the same as shown in the picture.
4).It is also the neutral pattern as the price is not showing any trend to go up or down.
5.Four Price Doji
1).From the following picture, no matter the BUY or SELL, Closed price or Open price, all be kept at an equivalent level.
2).There's no winner of Buyer or Seller, or Closed price or Open price.
3).It is a typical neutral pattern.
Q: Now let's check Simple Reversal Pattern.
1.Use one simple candlestick to analyze the reversal trend.
2.Imply a reversal trend.
Bullish candlesticks
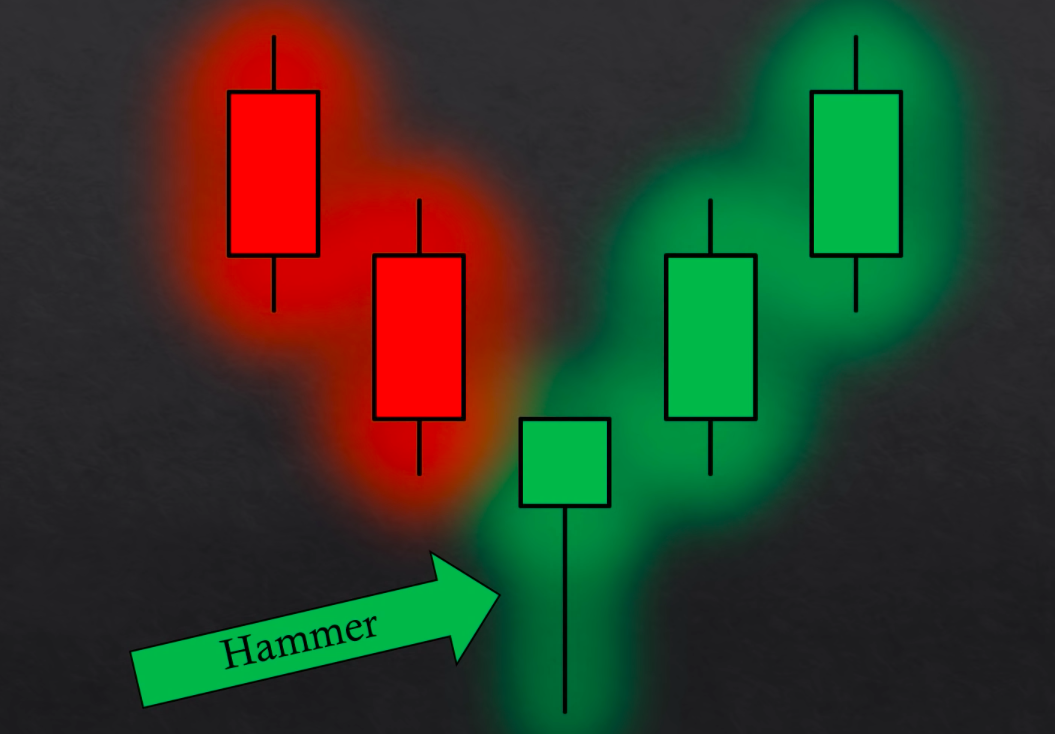
Hammer
1).Hammer itself is Bullish candlestick.
2).It shows that buying power is bigger than selling power, as upper tail is longer than lower tail or there's no lower tail exsisting.
3).Hammer appears after the price drops to a certain level, it implies the price is going up.
4).Hammer is not indicating the uptrend 100%, sometimes the major trend will keep on going after it appears.
Inverted Hammer
1).Inverted Hammer itself is also Bullish candlestick, similar to Hammer.
2).It shows that buying power was not strong enough to reach a new high point, but it still ended at a certain high level.
3).Inverted Hammer appears after the price drops to a certain level, it implies the price is going up.
4).Inverted Hammer is not indicating the uptrend 100%, sometimes the major trend will keep on going after it appears.
Bearish Candlesticks
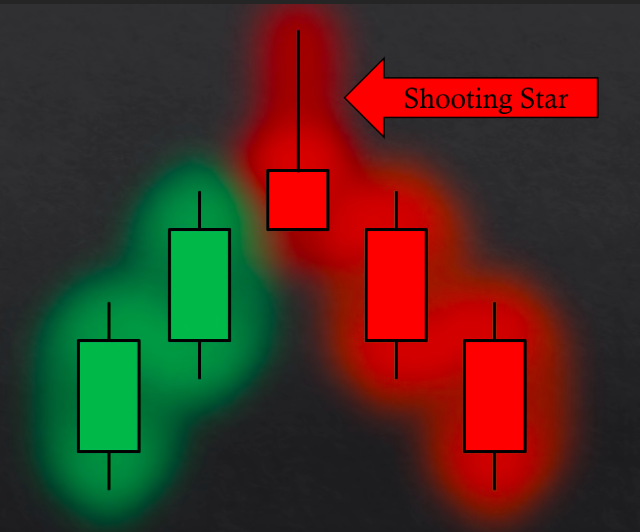
Shooting Star
1.Shooting Start itself is a Bearis reversal candlestick.
2.Similar shape as Inverted Hammer but it is in red, directing to downtrend.
3.It shows that Buying power was not strong enough and beaten Selling power.
4.It appears at the top of uptrend swing, it implies the price is going to drop.
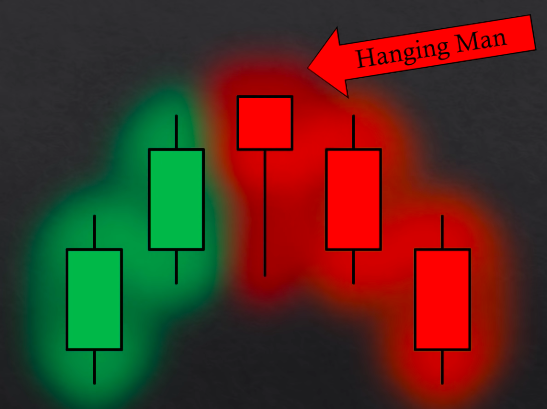
Hanging Man
1.Hanging Man itself is also a Bearis reversal candlestick.
2.Similar shape as Hammer but it is in red, directing to downtrend.
3.It shows that Buying power was not strong enough and beaten Selling power.
4.It appears at the top of uptrend swing, it implies the price is going to drop.
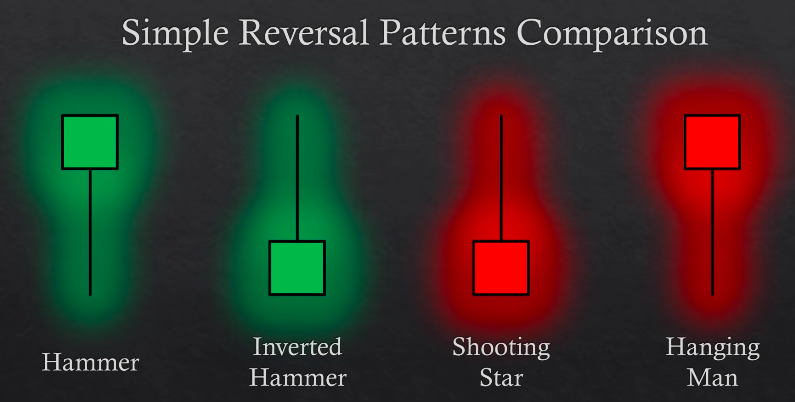
Conclusion:
The comparison of above Reversal candlesticks.
1.Hammer and Hanging Man are similar, only difference is Hammer in green, Hanging Man in red.
2.Inverted Hammer and Shooting Star are similar, only difference is Inverted Hammer in green, Shooting Star in red.
3.The Green body is Bullish, as Red body is Bearish.
4.Bearish candlesticks usually appear on the top of the uptrend swing, as Bullish candlesticks usually appear at the bottom of the downtrend swing.
Q: Let's take a look at Complex Reversal Pattern.
1.It includes two or more candlesticks.
2.Imply a reversal trend.
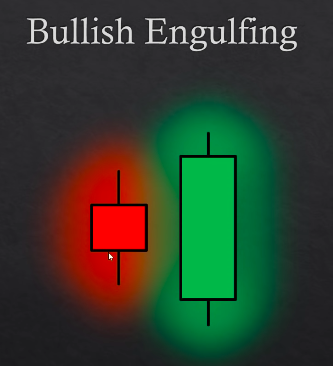
Bullish Engulfing
1.Big bullish candlestick appears after a short bearish candlestick.
2.It shows that the 2nd candlestick covers the previous one, open and close.
3.It is showing the buying power is big enough to create the change.
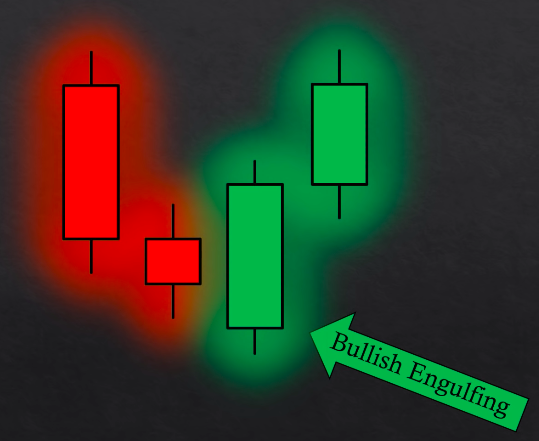
4.Below picture shows the Bullish Engulfing appears at the bottom of downtrend swing, and it is directing to reversal changes.
🔑 Register an account with Gate.io
👨💼 Complete KYC within 24 hours
🎁 Claim Points Rewards
