


🔑 Register an account with Gate.io
👨💼 Complete KYC within 24 hours
🎁 Claim Points Rewards
Your Gateway to crypto news and insights

Q: Last week we had the basic knowledge about Fibonacci. This event we will talk about one of the basic tools - Fib Retracement.
A: Let's go through the basic knowledge first.
1.Fibonacci numbers and lines are created by ratios found in Fibonacci's sequence.
2.Common Fibonacci numbers in financial markets are 0.236, 0.382, 0.618, 1.618, 2.618, 4.236.
3.The numbers reflect how far the price could go following another price move.
4.Fibonacci retracements measure how far a pullback could go.
5.Fibonacci is for the measure of single way trend, up or down.
Q: What Fibonacci levels mean to be?
A:
Fibonacci levels are used as guides, possible areas where a trade could develop. The price should confirm prior to acting on the Fibonacci level.
Q: Limitations of Using Fibonacci Numbers and Levels
A:
1.The usage of the Fibonacci studies is subjective since the trader must use highs and lows of their choice. Which highs and lows are chosen will affect the results a trader gets.
2.Only measure single way trend.
Q: How about the time frame to be used for Fibnacci?
A:
1.They are very popular with financial market technical analysis traders because they can be applied to any time frame.
2.If you used it for a long term time frame of 1M/1W/1D, maybe you will get entries once or twice a week, but it is more stable and safe.
3.If you use it for a short term time frame of 8H/4H/1H/30M, the you will get many entries but you will take more risks.
Q: Let's take a look at Fibnocci Retracement.
A:
1.Fibonacci Retracements. These are horizontal lines on a chart that indicate areas of support and resistance.
2.Fibonacci retracements can be used to determine how deep a pull back could be.
Q: Can you show us how to draw Fib Retracement and how to do analysis?
A: Let's study from a Youtube video. It is about 10mins, you will have a very basic idea about Fib Retracement.
https://www.youtube.com/watch?v=upubZ-4rSpk
And now, let's go to Trading View first.
1.Go to Pattern page and choose the tool from the left tool kit bar.
2.Select Fib Retracement.
3.Choose High and Low point of any part of Pattern. Choose a time frame you think is reasonable.
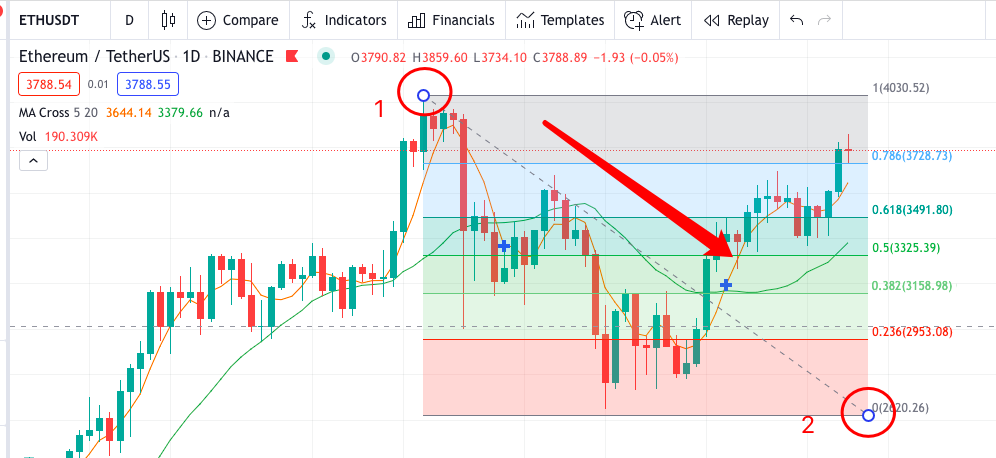
I chose D pattern of ETH/USDT as follows:
How I recognize the dropping will be the next trend?
1.Remember we studied MA line before? If the candle sticks all above MA line, it means there's the down trend. Adjust the measure of MA into 5 days.
2.And also, Volume is very low, which means the Buy power is not enough. It also shows the signal of a downtrend.

Remember Fib is very subjective and it's up to which direction you would like to go.
1.If you want to find an entry point to do Long contact, then draw it from lowest to highest point.
Below is Retracement for Long contract. Please pay attention to the points of 1 and 2.
2.If you want to find an entry pont to do Short contact, then draw it from highest to lowest point.
Below is Retracement for Short contract. Please pay attention to the points of 1 and 2.
Some users may ask if we draw from the point of candlewick or the top/bottom point of candlestick body?
It is a good question. And I did a test.
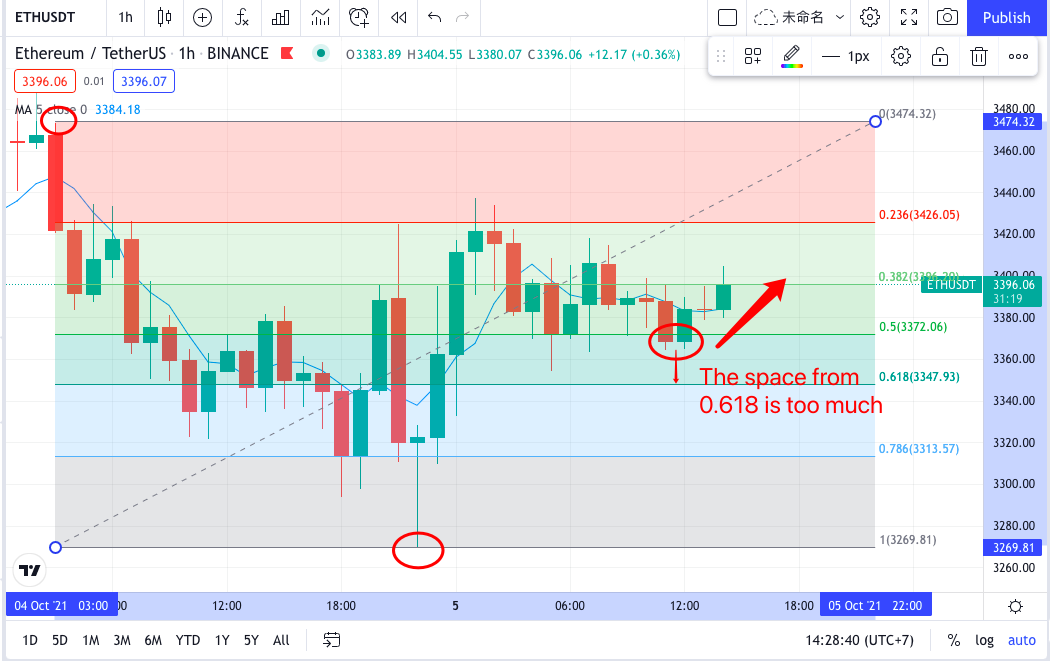
1.Below we draw from the lowest candlewick to the highest.
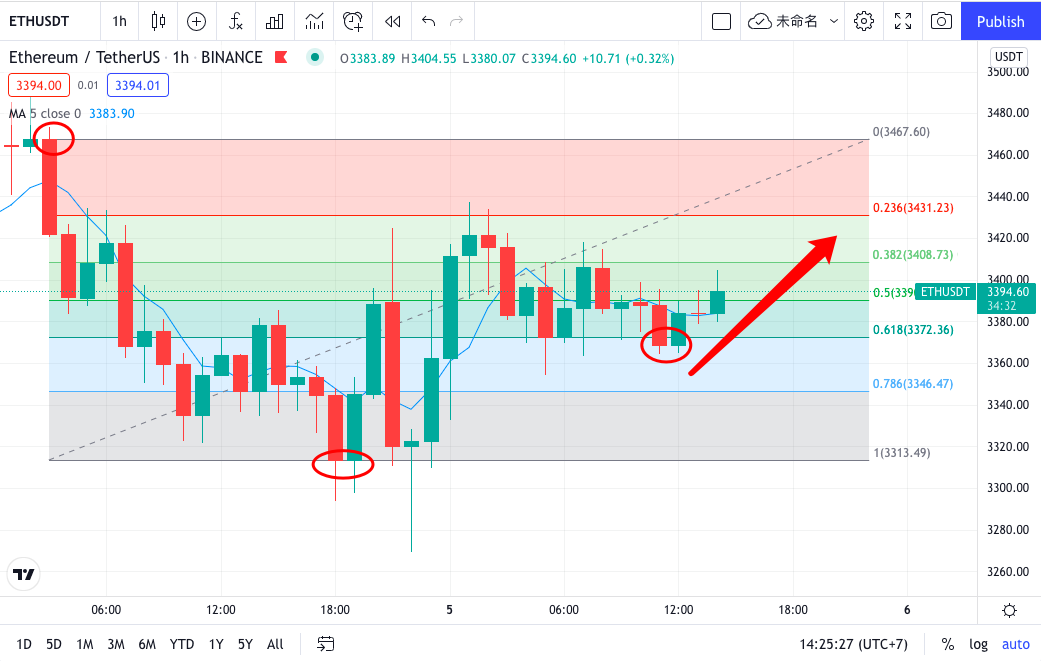
2.Below we draw from the lowest candlestick body to the highest.
Conclusion:
1.From above picture 1, the new pull back position is a little below 0.5, not yet reached 0.618.
2.From picture 2, the new pull back position has already touched 0.618.
3.Very clearly, picture 2 shows a more accurate situation. Also you can see the cross after Bullish candlestick, the uptrend is very obvious.
4.Please include candle wick and you can get a more accurate result.
Remarks:
1.As mentioned, Fibonacci is very subjective, you need to draw it case by case.
2.The coins as BTC and ETH have comparatively longer histories in the market, so the same data will appear repeatedly. The more times of the same signals appear at 0.618, 0.786, the more accurate the trend will be.
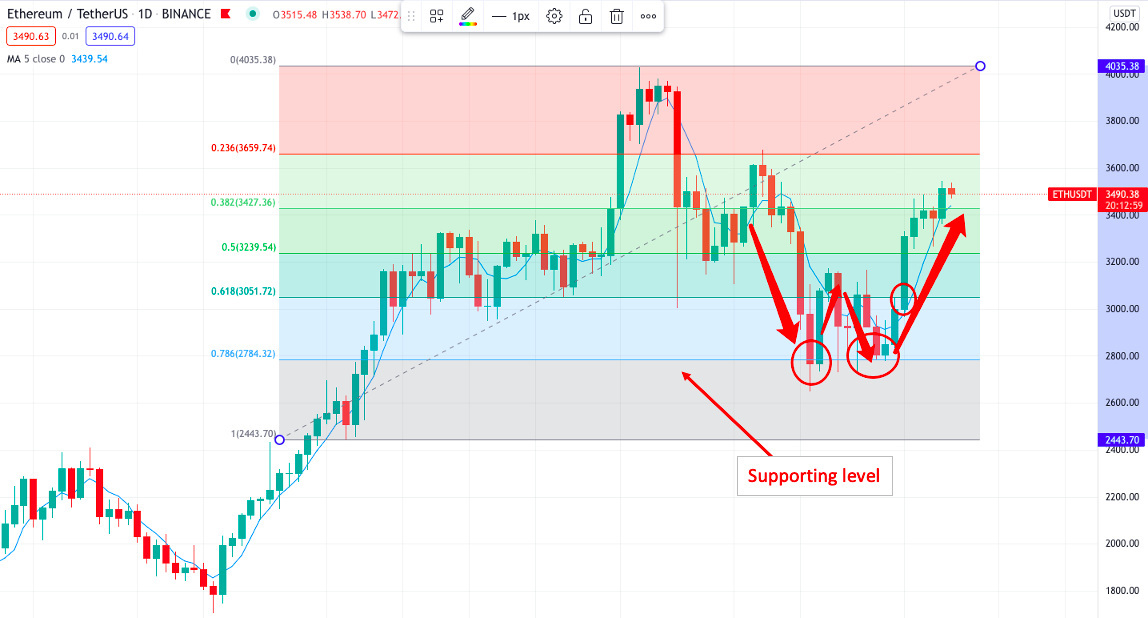
Please see below Retracement from Trading View of ETH/USDT,D-Pattern.
1.After several tests, I found the time span is bigger the better.
2.You can see from below, there are two times big retracement at 78.6%(0.768).
The supporting position range is around 2805-2850.
When you see the reversed hammer in Green, it shows the uptrend. And at this moment, you should start to observe and decide if to set up the entry price at 61.8%(0.618). You can see there's another big Bullish candlestick from 0.618.
3.Now the bearish candelwick touch 23.6%(0.236), ignore it and wait. Until there's the next retracement.
Conclusion:
1.Ignore 0.236(23.6%).
2.In fast moving market, you can choose the entry at 0.382(38.2%).
3.Usually 0.618(61.8%) is more reliable, but not all the time you can take it as the entry.
4.0.786(78.6%) 1.0(100%) are very strong levels only for strong market trends.
Q: Thanks for all of today.
A: Let's go to Question Session.
🔑 Register an account with Gate.io
👨💼 Complete KYC within 24 hours
🎁 Claim Points Rewards
