

Safe
SAFE
$0.02602
Safe (SAFE) Price Trends
Time period | Change amount | % Change |
|---|---|---|
1H | $-- | +0.10% |
24H | $-- | -- |
7D | $-- | -- |
30D | $-- | -- |
1Y | $-0.02000 | -42.23% |
Credibility Indicators
39.89
Reliability Score
Rank #1
# 10626
Percentile
BTM 15%
Live Safe (SAFE) Price Update
Safe price today is $0.02602 with a 24-hour trading volume of $370.31, and as such Safe has a market cap of $--, giving it a market dominance of 1.012%. The Safe price moved 0.00% in the last 24 hours.
Safe reached its highest price on 2022-01-11 when it was trading at its all-time high of $0.4853, while its lowest price was recorded on 2022-12-25 when it was trading at its all-time low of $0.01955. The current lowest price since the last cycle high was $0.01955, and the highest price since the last cycle low was $0.4853. The social sentiment of Safe is currently Positive.
The current circulating supply of Safe is $-- SAFE. In terms of market cap, Safe is currently ranked 10366.
About Safe (SAFE)
FAQs
1. What determines the price movement of Safe?
There are two schools of thought in determining the price of Safe.
By way of intrinsic value: This typically involves on-chain metrics, project metrics and financial metrics of Safe, collectively known as fundamental analysis. The law of supply and demand, tokenomics, use case, project roadmap as well as regulations and governance involved would affect the value of Safe from a long term perspective.
By way of price action: Primarily analyzed via candlestick chart patterns and technical indicators such as MACD, RSI and the bollinger bands, technical analysis forecasts the price of Safe on the basis that history tends to repeat itself. As the candlestick charts are a general representation of the emotion of the market, news announcements and community sentiment can be significant price action drivers for Safe as well.
Investors tend to prefer the long term nature of fundamental analysis, whereas short term traders tend to rely on technical analysis more. In reality, both analyses may combine and create interesting scenarios for Safe and the cryptocurrency market as a whole.
2. What is the highest price of Safe price in history?
3. What is the lowest price of Safe price in history?
4. What is the current market cap of Safe?
5. How many Safes are there in the market?
6. What is the maximum supply of Safe?
7. What is the fully diluted market cap (or FDV) of Safe?
8. What is the price prediction of Safe in the near future?
9. Is Safe a good investment?
10. How to buy Safe?
Safe Tokenomics
Next Unlock Events
Next Unlock Events
SAFE --
(--% Total Supply)
$--
(--% Market Cap)
Unlock Rounds --
--
D
--
Unlock Rounds --
--
D
--
SAFE --
(--% Total Supply)
$--
(--% Market Cap)
Allocations
Name | Total | Unlocked | Locked |
|---|---|---|---|
Geen record | |||
Vesting Schedule
Safe Analysis
Safe (SAFE) News

How Ethereum Founder Vitalik Buterin Keeps His Crypto Safe
"Decentralize your own security," says Ethereum founder Vitalik Buterin—but he doesn't use a cold wallet for his own personal crypto.
Safe token drops 42% after enabling transfers
Safe’s decentralized autonomous organization enabled token transferability on April 23 after achieving several milestones.

Safe Wallet scammer steals $2M through 'address poisoning' in one week
A malicious actor behind at least $5 million in crypto theft through “address poisoning" significantly ramped up attacks against Safe Wallet users in the last week.
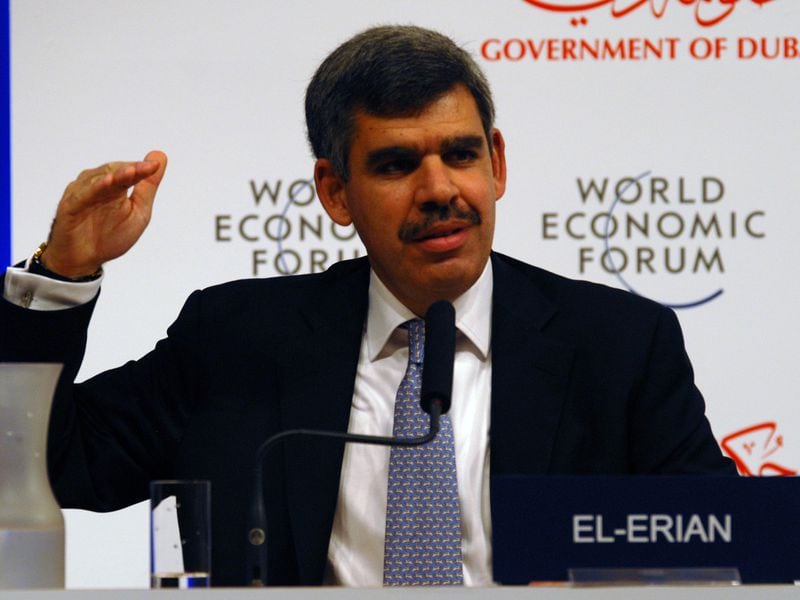
Bitcoin’s Safe Haven Status Bolstered by Treasury Underperformance, Mohamed El-Erian Says
"You have people talking about bitcoins, about equity, being the safe asset," El-Erian told CNBC.
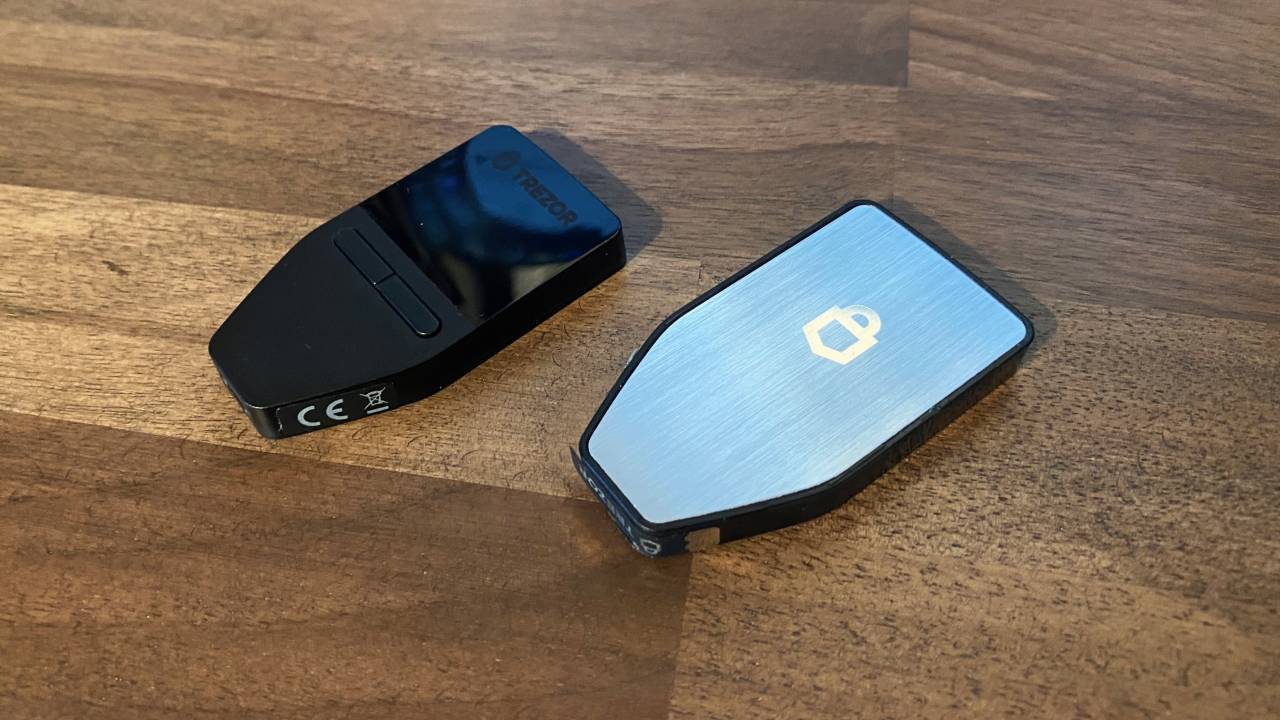
Trezor Safe 3 Review: A Hardware Wallet for Bitcoin Newcomers
The latest addition to Trezor’s lineup is aimed at “new entrants to crypto.” Does it make getting started simple?
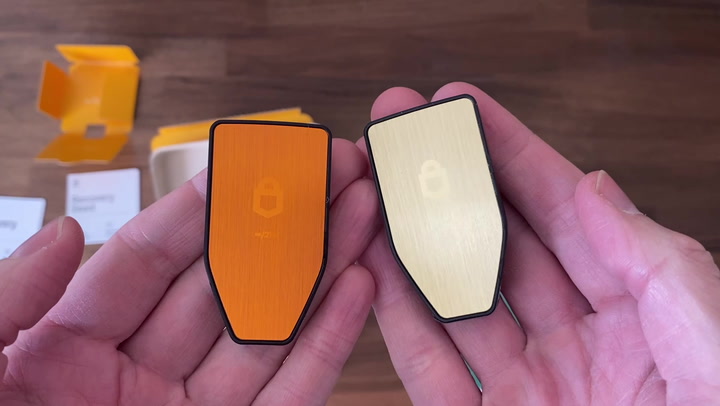
Trezor Safe 3 and Trezor Keep Metal Unboxing
Trezor has launched the Safe 3, a hardware wallet aimed at "new entrants to crypto," alongside the new Keep Metal recovery seed storage device. We take a first look at what comes in the box.
Date | Market Cap | Volume | Open | Close |
|---|---|---|---|---|
Geen record | ||||