


🔑 Register an account with Gate.io
👨💼 Complete KYC within 24 hours
🎁 Claim Points Rewards
Your Gateway to crypto news and insights
Firstly, let's go through the basic knowledge of Candlesticks, Shadow line, K-line Pattern and Volume bar.
Candlestick
1.Red - Bearish
Long solid Bearish, means down trend.
2.Green - Bullish, means uptrend.
3.Body of candlesticks
1) Long solid body, very firm situation, big down or up.
2) Short solid body, not very firm, a little down or up.
Candle wick
1.Top line, means the price was pushed up, the longer the price will go to reverse side deeper.
2.Bottom line, means the price was pushed down, the longer the price will go to reverse side deeper.
3.Which side is longer means the price will go to reverse side.
Candlestick + Candle wick
1.Candle body plus shadow lines will form a lot of different shapes.
Six bullish candlestick patterns
1.Hammer
The hammer candlestick pattern is formed of a short body with a long lower wick, and is found at the bottom of a downward trend.
A hammer shows that although there were selling pressures during the day, ultimately a strong buying pressure drove the price back up. The colour of the body can vary, but green hammers indicate a stronger bull market than red hammers.
2.Inverse hammer
A similarly bullish pattern is the inverted hammer. The only difference being that the upper wick is long, while the lower wick is short.
It indicates a buying pressure, followed by a selling pressure that was not strong enough to drive the market price down. The inverse hammer suggests that buyers will soon have control of the market.
3.Bullish engulfing
The bullish engulfing pattern is formed of two candlesticks. The first candle is a short red body that is completely engulfed by a larger green candle.
Though the next candlestick opens lower than the first, the bullish market pushes the price up, culminating in an obvious win for buyers.
4.Piercing line
The piercing line is also a two-stick pattern, made up of a long red candle, followed by a long green candle.
There is usually a significant gap down between the first candlestick’s closing price, and the green candlestick’s opening. It indicates a strong buying pressure, as the price is pushed up to or above the mid-price of the previous candlestick.
5.Morning star
The morning star candlestick pattern is considered a sign of hope in a bleak market downtrend. It is a three-stick pattern: one short-bodied candle between a long red and a long green. Traditionally, the ‘star’ will have no overlap with the longer bodies, as the market gaps both on open and close.
It signals that the selling pressure is subsiding, and a bull market is on the horizon.
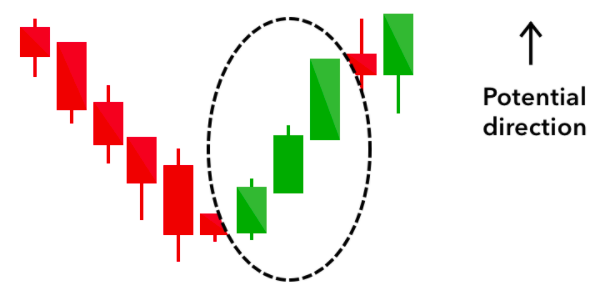
6.Three white soldiers
The three white soldiers pattern occurs over three days. It consists of consecutive long green (or white) candles with small wicks, which open and close progressively higher than the previous day.
It is a very strong bullish signal that occurs after a downtrend, and shows a steady advance of buying pressure.
Six bearish candlestick patterns
1.Hanging man
The hanging man is the bearish equivalent of a hammer; it has the same shape but forms at the end of an uptrend.
It indicates that there was a significant sell-off during the day, but that buyers were able to push the price up again. The large sell-off is often seen as an indication that the bulls are losing control of the market.
2.Shooting star
The shooting star is the same shape as the inverted hammer, but is formed in an uptrend: it has a small lower body, and a long upper wick.
Usually, the market will gap slightly higher on opening and rally to an intra-day high before closing at a price just above the open – like a star falling to the ground.
3.Bearish engulfing
A bearish engulfing pattern occurs at the end of an uptrend. The first candle has a small green body that is engulfed by a subsequent long red candle.
It signifies a peak or slowdown of price movement, and is a sign of an impending market downturn. The lower the second candle goes, the more significant the trend is likely to be.
4.Evening star
The evening star is a three-candlestick pattern that is the equivalent of the bullish morning star. It is formed of a short candle sandwiched between a long green candle and a large red candlestick.
It indicates the reversal of an uptrend, and is particularly strong when the third candlestick erases the gains of the first candle.
5.Three black crows
The three black crows candlestick pattern comprises of three consecutive long red candles with short or non-existent wicks. Each session opens at a similar price to the previous day, but selling pressures push the price lower and lower with each close.
Traders interpret this pattern as the start of a bearish downtrend, as the sellers have overtaken the buyers during three successive trading days.
6.Dark cloud cover
The dark cloud cover candlestick pattern indicates a bearish reversal – a black cloud over the previous day’s optimism. It comprises two candlesticks: a red candlestick which opens above the previous green body, and closes below its midpoint.
It signals that the bears have taken over the session, pushing the price sharply lower. If the wicks of the candles are short it suggests that the downtrend was extremely decisive.
Four continuation candlestick patterns
If a candlestick pattern doesn’t indicate a change in market direction, it is what is known as a continuation pattern. These can help traders to identify a period of rest in the market, when there is market indecision or neutral price movement.
1.Doji
When a market’s open and close are almost at the same price point, the candlestick resembles a cross or plus sign – traders should look out for a short to non-existent body, with wicks of varying length.
This doji’s pattern conveys a struggle between buyers and sellers that results in no net gain for either side. Alone a doji is neutral signal, but it can be found in reversal patterns such as the bullish morning star and bearish evening star.
2.Spinning top
The spinning top candlestick pattern has a short body centred between wicks of equal length. The pattern indicates indecision in the market, resulting in no meaningful change in price: the bulls sent the price higher, while the bears pushed it low again. Spinning tops are often interpreted as a period of consolidation, or rest, following a significant uptrend or downtrend.
3.Falling three methods
Three-method formation patterns are used to predict the continuation of a current trend, be it bearish or bullish.
The bearish pattern is called the ‘falling three methods’. It is formed of a long red body, followed by three small green bodies, and another red body – the green candles are all contained within the range of the bearish bodies. It shows traders that the bulls do not have enough strength to reverse the trend.
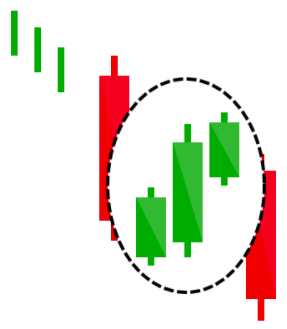
4.Rising three methods
The opposite is true for the bullish pattern, called the ‘rising three methods’ candlestick pattern. It comprises of three short reds sandwiched within the range of two long greens. The pattern shows traders that, despite some selling pressure, buyers are retaining control of the market.
Don't forget the leverage.
1.The leverage, for new beginners, you can use 5U plus 10-20X leverage to test.
2.Where to click leverage.
Realtime Analysis
BTC or ETH
Summary:
1.When all the indicators point in one direction, it is the good timing.
2.If there's any conflicts, calculate how many indicators you used and how much percentage has the conflict is. Then you can know how much percentage of the success that you can win.
3.No perfect trade, no 100% success.
🔑 Register an account with Gate.io
👨💼 Complete KYC within 24 hours
🎁 Claim Points Rewards
