


🔑 Register an account with Gate.io
👨💼 Complete KYC within 24 hours
🎁 Claim Points Rewards
Your Gateway to crypto news and insights
Q: Today let's review the Fib tools of Arcs, Fans and Time Zone.
A: Please pay attention to below points:
1.The usage of the Fibonacci studies is subjective since the trader must use highs and lows of their choice. Which highs and lows are chosen will affect the results a trader gets.
2.Only measure single way trend.
Q: Let's review the time frame to be used to Fibnacci.
A:
They are very popular with financial market technical analysis traders because they can be applied to any time frame.
Q: And let's go through again what is the meaning of Fib Arcs and Fans.
1.Fibonacci Arcs. These are compass-like movements from a high or low that represent areas of support and resistance.
Fibonacci arcs are typically used to connect two significant price points, such as a swing high and a swing low.
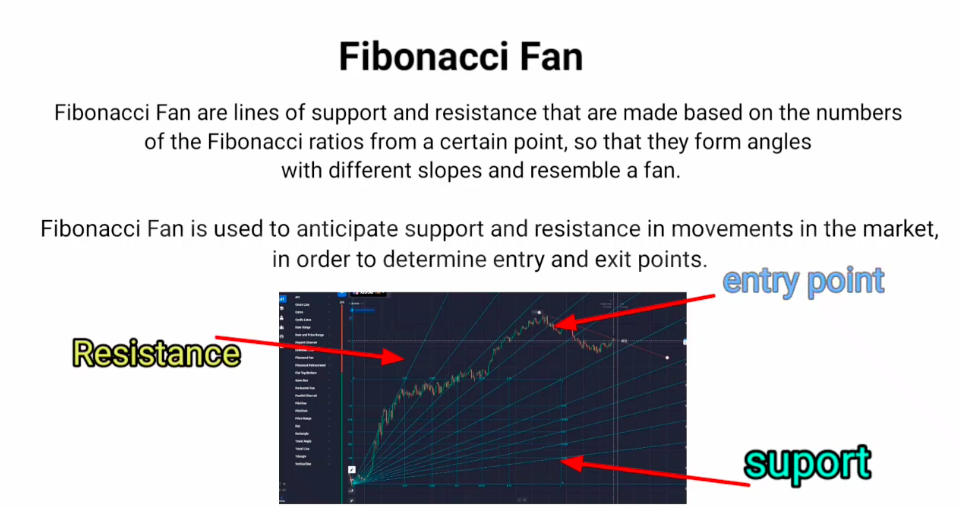
2.Fibonacci Fans. These are diagonal lines created using a high and a low that represent areas of support and resistance.
A Fibonacci fan is a method of plotting support and resistance levels based on the ratios provided by the Fibonacci series.
Trendlines are drawn at intervals of 23.6, 38.2, 50, and 61.8 percent apart to predict retracements.
3.Fibonacci Time Zone, are vertical lines that represent potential areas where a swing high, low, or reversal could occur.
Fibonacci time zones are time-based areas to be aware of.
Fibonacci time zones only indicate potential areas of importance related to time.
Conclusion:
1.Arcs and Fans are very similar tools that present areas of support and resistance.
2.Basically these two tools are similar to Fib Retracement. To analyze the price pull back level.
3.Time Zone shouldn't be used individually, you have to combine other tools altogether to ensure the entry and resistance.
Q: Let's study again how to draw Arcs, Fans and Time Zones.
A:
Fib Arcs
1.Go to Trading View, select a trade pair.
2.Select the Arc tool from the left tool kit.
3,Draw the point from low to high or high to low, according to the trend. This is the same rule as Fib Retracement.
From below, we draw from low point 1 to high point 2.
The same as Retracement, the pull back touched circle of 0.382, 0.5, 0.618 and 0.786.
Compared to Retracement, the circle touched with candlesticks, they call it the resistance. Please see the yellow marked parts.
Fib Fans
Please go to the link below to study how to draw it.
https://www.youtube.com/watch?v=XVI4cxOqobw
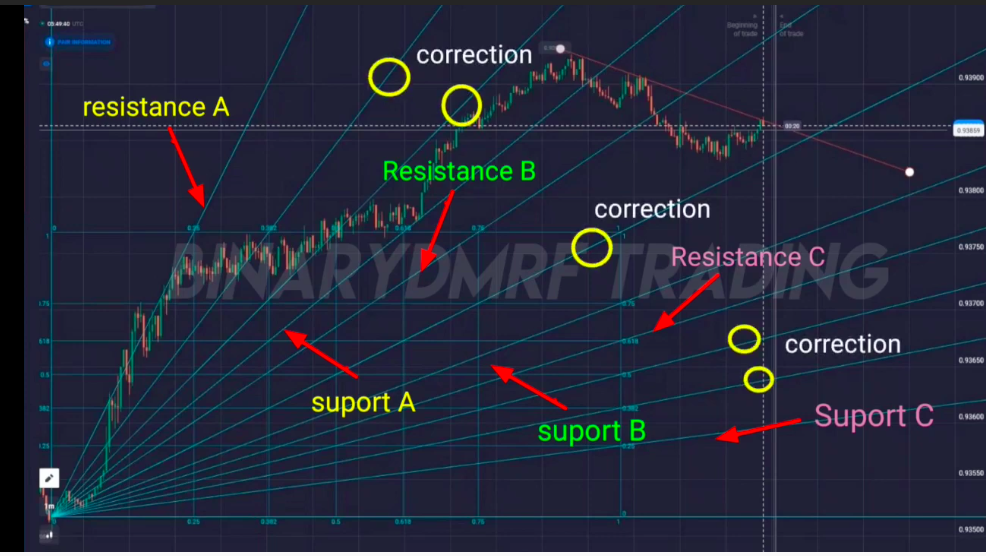
1/5/8 lines, are for Resistance
4/7/11 lines, are for Support
2/3/6/9/10, are for Corrections
Strong area, line 1-4
Middle area, line 4-8
Weak area, line 8-11
1.Same as Fib Arcs, select tool from left side Tool Kit.
2.There're three strategies:
1) When the trend is up, and the candle moves down and breaks the support line, the next movement will go down.
2) When the trend is up, and the candle moves down but fails to break the support line, the next movement will move up.
3) When the candle is in the correction line, use the short period trend line to mark the trend.
Fib Time Zones
Please go to the link below to study basic drawing skills.
https://www.youtube.com/watch?v=6aIM2a8jJHY
1.Go to Trading View, select trade pair.
2.Select Trend-Based Fib Time tool from the left tool kit.

3.Find the trend and draw from low to high or high to low.
From Youtube, he smartly drew a basic trend line to show out the current trend. It is a good way to help you to analyze the basic trend.
And then you can set up the start point from the low to high.
Obviously, the bullish candlestick touched 0.618 on Setp.30th and up until Oct 11th. The ratio of Oct. 12th is 1.382, this ratio is not very popular as it is not golden ratio.
Golden ratio 1.618 is at the line of Oct.15th.
From the pattern below, after a long bullish candlestick, there's the possibility that it may start to go down.
So there are two possibilities.
1)The pull back at 1.681 of Oct. 15th.
2)The break through at 1.681 of Oct. 15th.
Conclusion:
1.Remember to combine other tools to analyze the possibilities.
2.At this moment, you can use Retracement to analyze the pull back, as now it is the signal of changing.
🔑 Register an account with Gate.io
👨💼 Complete KYC within 24 hours
🎁 Claim Points Rewards
