การวิเคราะห์ปัจจัยพื้นฐานคืออะไร?

การวิเคราะห์พื้นฐานของ Cryptocurrencies คืออะไร?
โครงการ Cryptocurrency เพิ่งเฟื่องฟูหลังปี 2020 ตั้งแต่นั้นเป็นต้นมา สถานการณ์การใช้งานที่หลากหลายและสร้างสรรค์ได้เกิดขึ้น อย่างไรก็ตาม ตลาดคริปโตมีความผันผวนอย่างมาก โดยมีความเสี่ยงและโอกาสอยู่ร่วมกัน การออกแบบโมเดลการวิเคราะห์ปัจจัยพื้นฐานที่กำหนดเองจะช่วยให้คุณตัดสินใจลงทุนได้อย่างมีระเบียบวินัยมากขึ้น เนื่องจากคุณสมบัติการลงทุน crypto ที่มีความเสี่ยงสูงและให้ผลตอบแทนสูง รูปแบบการวิเคราะห์ที่ออกแบบมาอย่างดีจะทำให้กลยุทธ์การลงทุนของคุณดีขึ้น ซื้อขาย. คุณอาจเคยได้ยินคำว่า “หนึ่งวันใน crypto เท่ากับสิบปีในตลาดการเงินแบบดั้งเดิม” นี่เป็นเพราะกฎ “จำกัดขึ้น-จำกัดลง” ในตลาดหุ้นป้องกันทั้งผลกำไรที่มากเกินไปและการขาดทุนที่เพิ่มขึ้น เมื่อการเปลี่ยนแปลงราคาเกินขีดจำกัด จะทำให้การซื้อขายหยุดลง อย่างไรก็ตาม ในตลาดคริปโตเคอเรนซีเกิดใหม่ ไม่มีการจำกัดราคาหรือเวลาซื้อขาย คุณสามารถแลกเปลี่ยน crypto ได้ทุกนาที อย่างไรก็ตาม ศักยภาพมหาศาลในการทำกำไรนั้นมาพร้อมกับความเสี่ยงที่สูงเสมอ ภายใต้กฎหมาย มีวิธีที่เหมาะสมที่สุดที่นักลงทุนสามารถใช้ในการตัดสินใจลงทุนที่ดีที่สุดได้หรือไม่?
การวิเคราะห์ปัจจัยพื้นฐานคืออะไร?
ในตลาดการเงินแบบดั้งเดิม นักลงทุนต้องตัดสินใจเพื่อตอบสนองต่อการเปลี่ยนแปลงของตลาด การตัดสินใจที่เหมาะสมทุกครั้งเกิดจากการใช้วิธีการวิเคราะห์ที่เหมาะสม โดยพื้นฐานแล้ว วิธีการวิเคราะห์สามารถแบ่งออกได้เป็นสามประเภท ได้แก่ การวิเคราะห์ปัจจัยพื้นฐาน ทางเทคนิค และต้นทุนตำแหน่ง การวิเคราะห์ปัจจัยพื้นฐานในตลาดหุ้นแบบดั้งเดิมคือการทำความเข้าใจสถานะทางการเงินและความสามารถในการทำกำไรของบริษัทผ่านการวิเคราะห์งบการเงินสามฉบับและตัวบ่งชี้หลักสี่ตัว ดังนั้นการพิจารณาว่าสมควรได้รับการลงทุนระยะยาวหรือไม่
งบการเงิน 3 งบการเงินข้างต้นประกอบด้วย งบกำไรขาดทุน (เพื่อพิจารณาว่าบริษัทมีกำไรสุทธิหรือไม่) งบดุล (เพื่อตรวจสอบสินทรัพย์และหนี้สินของบริษัท) และงบกระแสเงินสด (เพื่อดูว่าเงินสดมีสภาพคล่องสูงเพียงใด บริษัทเป็นเจ้าของ)
ตัวบ่งชี้ทั้งสี่ประกอบด้วย Earnings Per Share (EP) ที่แสดงผลกำไรที่แต่ละหุ้นนำมา อัตราส่วนราคาต่อกำไร (PE) ที่คาดการณ์ระยะเวลาที่หุ้นจะไปถึงจุดคุ้มทุน และอัตราส่วนราคาตามบัญชี (PB) ที่ คำนวณอัตรากำไรขั้นต้นจากการดำเนินงานและตัดสินว่าราคาหุ้นยุติธรรมหรือไม่
โดยสรุปแล้ว การวิเคราะห์ปัจจัยพื้นฐานเป็นวิธีการที่สำคัญที่สุดที่นักลงทุนใช้ในการประเมินว่าสินทรัพย์มีมูลค่าสูงเกินไปหรือต่ำกว่ามูลค่าทั้งในตลาดหุ้นแบบดั้งเดิมและตลาดสกุลเงินดิจิทัลที่เกิดขึ้นใหม่
Cryptocurrencies และการวิเคราะห์พื้นฐาน
แตกต่างจากบริษัทจดทะเบียนในตลาดหุ้น โครงการ crypto ไม่มีงบการเงินรายไตรมาสสำหรับนักลงทุน ดังนั้น งบการเงินหลักสามรายการและตัวบ่งชี้หลักสี่รายการจึงใช้ไม่ได้ในตลาดเกิดใหม่ crypto
เนื่องจากลักษณะการกระจายอำนาจของ cryptocurrencies จึงไม่มีมาตรการสากลที่สามารถใช้กับพื้นที่ crypto ทั้งหมดได้ เนื่องจากคำบอกเล่าที่ดูเหมือนน่าเชื่อถืออาจเป็นของปลอม นักลงทุนจึงต้องเรียนรู้ที่จะระบุข้อมูลจริงและพิจารณาว่าแหล่งข้อมูลนั้นเชื่อถือได้หรือไม่ บัญชี Twitter หรือกลุ่ม Telegram ที่คุณติดตามอาจเผยแพร่ข่าวที่ไม่ได้รับการยืนยัน และจำนวนที่อยู่ที่ใช้งานบนบล็อกเชนที่เพิ่มขึ้นก็อาจเป็นข้อมูลปลอมได้เช่นกัน
แล้วอะไรคือตัวบ่งชี้และเครื่องมือที่เหมาะสมที่ทำงานได้ดีที่สุดกับข่าวตลาดเพื่อทำการวิเคราะห์ปัจจัยพื้นฐานที่ดีที่สุดเท่าที่จะเป็นไปได้เพื่ออำนวยความสะดวกในการตัดสินใจในตลาด crypto?
ด้านล่างนี้คือการวิเคราะห์โดยละเอียดของเมตริกพื้นฐานสามตัว ตัวบ่งชี้หลักสามตัว เครื่องมือวิเคราะห์ และข่าวการตลาดของการวิเคราะห์พื้นฐานของสกุลเงินดิจิทัล
สามเมตริกพื้นฐาน
1.ตัวชี้วัดบนเครือข่าย
เมตริกบนเครือข่ายหมายถึงข้อมูลที่สามารถใช้สังเกตบล็อกเชนเป็นตัวบ่งชี้ในการตัดสินแนวโน้มของตลาด อย่างไรก็ตาม การรวบรวมข้อมูลของโหนดเดียวเพียงอย่างเดียวนั้นใช้เวลานานและใช้แรงงานมาก นักลงทุนอาจอ้างอิงข้อมูลที่จัดทำโดยเว็บไซต์ที่ออกแบบมาโดยเฉพาะสำหรับการตัดสินใจลงทุน หรือดึงข้อมูลที่จำเป็นจาก API (Application Programming Interfaces)
จำนวนธุรกรรม
สามารถใช้เป็นมาตรการง่ายๆ ในการประเมินกิจกรรมเครือข่าย จากการสังเกตกิจกรรมการทำธุรกรรมเป็นระยะเวลาหนึ่ง เราสามารถเห็นการเปลี่ยนแปลงของจำนวนธุรกรรมในห่วงโซ่ อย่างไรก็ตาม สิ่งนี้ไม่ได้รับประกันว่าข้อมูลทั้งหมดเป็นข้อมูลจริงและไม่ได้เพิ่มขึ้นเทียมจากการโอนสินทรัพย์ระหว่างกระเป๋าเงินต่างๆ ของนักลงทุนรายเดียวกัน คุณควรให้ความสนใจเป็นพิเศษกับการฉ้อโกงข้อมูล
ปริมาณธุรกรรม
ซึ่งแตกต่างจากจำนวนธุรกรรมที่กล่าวถึงข้างต้น ปริมาณธุรกรรมหมายถึงมูลค่ารวมที่ซื้อขายในช่วงเวลาที่แน่นอน ปริมาณธุรกรรมทั้งหมดบนเครือข่ายเท่ากับจำนวนธุรกรรมคูณด้วยจำนวนธุรกรรมแต่ละรายการ
ที่อยู่ที่ใช้งานอยู่
หมายถึงที่อยู่ blockchain ที่ใช้งานในช่วงเวลาที่กำหนด ท่ามกลางวิธีการต่างๆ ในการตัดสินว่าที่อยู่ที่ทำงานอยู่หรือไม่ เรามักจะติดตามที่อยู่ที่ใช้งานทั้งหมดโดยการสังเกตจำนวนที่อยู่ที่ส่งและรับของธุรกรรมบนเครือข่ายแต่ละรายการในช่วงระยะเวลาหนึ่ง และคำนวณผลรวมตามช่วงเวลาปกติ
ชำระค่าธรรมเนียมการทำธุรกรรม
หากบล็อกเชนแออัดและใช้เวลานานขึ้นในการทำธุรกรรม เราสามารถเร่งการทำธุรกรรมโดยเพิ่มค่าธรรมเนียมการทำธุรกรรม หากบล็อกเชนดำเนินไปอย่างราบรื่นและใช้เวลาไม่นานในการทำธุรกรรม เราสามารถลดความเร็วการทำธุรกรรมและประหยัดค่าธรรมเนียมการทำธุรกรรมได้ จากค่าธรรมเนียมการทำธุรกรรม เราสามารถเห็นความต้องการของนักเทรดโดยตรงสำหรับบล็อคเชนเฉพาะ ยิ่งความต้องการสูง บล็อกเชนก็ยิ่งแออัด และค่าธรรมเนียมการทำธุรกรรมก็จะยิ่งสูงขึ้น
อัตราแฮช (พลังการคำนวณ) และจำนวนเงินเดิมพัน
ในระบบบัญชีแยกประเภทแบบกระจายของบล็อกเชน จำเป็นต้องมีกลไกบางอย่างเพื่อกำหนดลำดับการทำงานของโหนดเครือข่าย กลไกนี้ขึ้นอยู่กับการคำนวณโหนดเรียกว่าอัลกอริทึมฉันทามติซึ่งมีความสำคัญมากต่อความเสถียรและความปลอดภัยของบล็อกเชน
อัลกอริธึมหลักที่สอดคล้องกันมากที่สุดอย่างหนึ่งคือ Proof of Work (PoW) สำหรับ Bitcoin จะใช้อัตราแฮช เช่น พลังการประมวลผล - พลังการประมวลผลทั้งหมดของการขุดหรือประมวลผลธุรกรรมบนบล็อกเชน ธุรกรรมบนเครือข่ายถูกเชื่อมโยงเข้าด้วยกันและไม่สามารถเปลี่ยนแปลงได้ ยกตัวอย่างการโจมตี 51% ทั่วไป หากแฮ็กเกอร์ต้องการยุ่งเกี่ยวกับหรือปลอมแปลงข้อมูลบล็อกเชน พวกเขาต้องควบคุมมากกว่า 51% ของโหนดเครือข่ายทั้งหมดเพื่อให้เป็นไปได้ ดังนั้นยิ่งอัตราแฮชสูง ความยากของการโจมตี 51% ก็จะยิ่งสูงขึ้น
อัลกอริธึมที่เป็นเอกฉันท์ทั่วไปอีกอย่างหนึ่งคือ Proof of Stake (PoS) โดยพื้นฐานแล้ว ต้องใช้สินทรัพย์ในการเดิมพันเพื่อเข้าร่วมการตรวจสอบการบล็อก เราสามารถบอกความต้องการของตลาดได้โดยการตรวจสอบจำนวนการเดิมพัน
2.ตัวชี้วัดของโครงการ
เมตริกโครงการใช้เพื่อประเมินประสิทธิภาพของทีมงานโครงการและผลลัพธ์ของโครงการในรูปแบบต่างๆ
whitepaper
สมุดปกขาวเป็นเหมือนหนังสือชี้ชวนของหุ้น แต่เน้นที่การวิจัยและข้อมูลทางเทคนิคที่เกี่ยวข้องกับโครงการมากกว่า ซึ่งเป็นช่องทางให้สาธารณชนเข้าใจว่าโครงการทำงานอย่างไร เช่นเดียวกับภาพที่เห็นและการจัดสรรทรัพยากรเบื้องต้น โดยเฉพาะอย่างยิ่ง เอกสารไวท์เปเปอร์ครอบคลุมถึง:
- เทคโนโลยี
- ใช้กรณี
- แผนงานสำหรับการอัปเกรดหรือคุณสมบัติใหม่
- การจัดหาและการออกโทเค็น
ทีม
เนื่องจากทีมงานโครงการ cryptocurrency ส่วนใหญ่จะโพสต์ข้อมูลของสมาชิกในทีมของตนบน GitHub การรับข้อมูลที่เกี่ยวข้องจึงสะดวกมาก GitHub เป็นแพลตฟอร์มโอเพ่นซอร์สที่ใช้บ่อยที่สุดสำหรับนักพัฒนาเนื่องจากมีต้นทุนต่ำ ผู้ใช้ที่ลงทะเบียนของแพลตฟอร์มนี้สามารถอัปโหลดไฟล์และข้อมูลไปยังบัญชีของพวกเขา ทำให้ทุกคนสามารถเข้าถึงได้แบบสาธารณะ ดังนั้นจึงเป็นไปได้ที่จะรู้ว่าทีมมีทักษะที่จำเป็นในการทำให้โครงการเป็นจริง หรือประเมินว่าทีมมีประวัติที่น่าอับอายหรือไม่โดยการประเมินประสบการณ์ในอดีตของสมาชิกที่เปิดเผยและอ่านข่าวที่เกี่ยวข้อง
คู่แข่ง
หลังจากทำการค้นคว้าอย่างเพียงพอเกี่ยวกับเอกสารไวท์เปเปอร์และทีมแล้ว คุณสามารถวิเคราะห์เปรียบเทียบคู่สัญญาของแอปพลิเคชันที่คล้ายคลึงกันได้ เมื่อเปรียบเทียบกับผลิตภัณฑ์และโครงการคู่แข่งที่คุณสนใจด้วยตัวบ่งชี้หลายตัว คุณสามารถประเมินได้ว่าโครงการสามารถเปลี่ยนได้ง่ายหรือไม่
Tokenomics และการกระจายโทเค็นเริ่มต้น
จำเป็นต้องตรวจสอบว่าโทเค็นมีกรณีการใช้งานจริง กระแสเงินสดดำเนินการอย่างไร เป็นต้น มูลค่าที่แท้จริงจะมีอยู่ก็ต่อเมื่อโทเค็นมีการใช้งานจริงและได้รับการยอมรับจากตลาด
เราควรพิจารณาปัจจัยสำคัญอีกประการ - วิธีจัดสรรโทเค็นเริ่มต้น หากได้รับการจัดสรรผ่านการเสนอขายเหรียญเริ่มต้น (ICO) หรือ Initial Exchange Offer (IEO) สมุดปกขาวควรระบุเปอร์เซ็นต์ของโทเค็นที่ผู้ก่อตั้งและทีมใช้และเก็บรักษา รวมถึงจำนวนโทเค็นที่มีให้สำหรับนักลงทุน และผ่าน Initial Model Offer (IMO) คุณสามารถดูหลักฐานการประกาศเหมืองบนเครือข่ายที่คุณเคยโพสต์ไว้
บางครั้งควรใช้หลักความน่าเชื่อถือสำหรับเมตริกโครงการ เนื่องจากนักลงทุนสามารถตัดสินได้จากข้อมูลที่เปิดเผยโดยทีมงานเท่านั้น ข้อมูลที่ซ่อนอยู่หรือการเปิดเผยที่ผิดพลาดจะก่อให้เกิดความเสี่ยงที่อาจเกิดขึ้นได้
3. เมตริกทางการเงิน
แตกต่างจากเครื่องมือวิเคราะห์พื้นฐานทางการเงินแบบดั้งเดิมที่ประเมินข้อมูลสาธารณะ เช่น ปริมาณการซื้อขาย ราคา และสภาพคล่อง เมตริกทางการเงินในการเข้ารหัสลับจะเน้นที่ข้อตกลงหรือมาตรการจูงใจ
Market Cap (มูลค่าเครือข่าย)
มูลค่าตลาดเท่ากับโทเค็นหมุนเวียนคูณด้วยราคาโทเค็น Market Cap หมายถึงต้นทุนสมมุติฐาน (ไม่รวม Slippage) ต่อหน่วยของการซื้อโทเค็น ตัวอย่างเช่น หากมีการออกโทเค็น 1 ล้านโทเค็นและราคาซื้อขายคือ 1 ดอลลาร์ มูลค่ารวมตามราคาตลาดคือ 1 ล้านดอลลาร์ ซึ่งสร้างขึ้นจากความว่างเปล่าทั้งหมด มูลค่าตลาดบิดเบี้ยวอย่างเห็นได้ชัด โทเค็นจะไร้ค่าหากความนิยมลดลงและความต้องการลดลงหลังจากผ่านไประยะหนึ่ง
นอกจากความผันผวนของราคาแล้ว จำนวนของโทเค็นที่หมุนเวียนก็ไม่แน่นอนเช่นกัน เนื่องจากโทเค็นอาจถูกทำลายหรือสูญหายในการโอนหรือเนื่องจากกุญแจหาย อย่างไรก็ตาม ส่วนแบ่งการตลาดยังคงถูกใช้เพื่อประเมินศักยภาพในการเติบโตของเครือข่าย นักลงทุนคริปโตบางคนเชื่อว่าเหรียญที่มี Market Cap ขนาดเล็กมีศักยภาพในการเติบโตสูงกว่าเหรียญกระแสหลักอย่าง Bitcoin และ Ethereum
ตัวอย่างมูลค่าตลาดของ Bitcoin: ราคา BTC อยู่ที่ $20,669 และอุปทานหมุนเวียนอยู่ที่ 19,087,475
มูลค่าตลาดรวมในการหมุนเวียนอยู่ที่ประมาณ $394.5 พันล้าน ($20,669 x 19,087,475 BTC = 394,536,772,126)

โดย CoinMarketCap
สภาพคล่องและปริมาณการซื้อขาย
สภาพคล่องหมายถึงความเร็วของเงิน ในตลาดที่มีสภาพคล่องสูง การซื้อหรือขายสินทรัพย์ในราคาที่ยุติธรรมทำได้ง่ายและรวดเร็ว ในขณะที่มีสภาพคล่องไม่เพียงพอ สินทรัพย์ไม่สามารถซื้อขายได้ในราคาที่สอดคล้องกับตลาดที่มีประสิทธิภาพ
ปริมาณการซื้อขายเป็นตัวบ่งชี้ที่ช่วยกำหนดสภาพคล่อง แผนภูมิจะบันทึกปริมาณการซื้อขายและมูลค่าการซื้อขายในช่วงเวลาที่กำหนด สภาพคล่องสามารถช่วยกำหนดความต้องการของตลาดได้
รายการตลาด Gate.io และคู่ซื้อขาย - ตามปริมาณ | อันดับเหรียญ
กลไกการจัดหา
กลไกการจัดหาสกุลเงินที่อยู่เบื้องหลังโทเค็นนั้นค่อนข้างสำคัญ อุปทานสูงสุด การไหลเวียนของตลาด และอัตราเงินเฟ้อจะกำหนดผลกระทบทางอ้อมต่อราคา ซึ่งหมายความว่าหากจำนวนโทเค็นเพิ่มขึ้นและความต้องการยังคงเท่าเดิม ราคาซื้อขายจะลดลง
หลังจากช่วงเวลาหนึ่ง โทเค็นบางตัวจะลดจำนวนเหรียญใหม่ที่สร้างขึ้นและลดอุปทานทั้งหมดเพื่อรักษาราคา ดังนั้นจึงสามารถใช้อุปทานเป็นเกณฑ์ในการตรวจสอบว่ามีปัญหาเพิ่มเติมไม่จำกัดหรือไม่ หากเป็นเช่นนั้น จะทำให้เกิดภาวะเงินเฟ้อและราคาต่ำ และสร้างความเสียหายต่อตลาด
สามตัวบ่งชี้ที่สำคัญ
1. Market Capitalization (MC) และ Fully Diluted Valuation (FDV)
(ในตัวอย่างต่อไปนี้ สมมติว่าราคาตลาดปัจจุบันของโทเค็น A คือ $1 อุปทานหมุนเวียนคือ 1,000 และอุปทานสูงสุดคือ 10,000)
การประเมินมูลค่าเต็มปรับลด (FDV)
FDV = ปริมาณสูงสุดของโทเค็น X ราคาตลาดปัจจุบันของโทเค็น = 10,000 X 1 = 10,000
FDV เป็นตัวบ่งชี้ที่สามารถใช้ในการประเมินมูลค่าตลาดในอนาคตของโครงการ นั่นคือหากทีมปลดล็อกโทเค็นทั้งหมดและนำเข้าสู่ตลาด FDV จะแสดงมูลค่าในอนาคตของโครงการในราคาปัจจุบัน
มูลค่าหลักทรัพย์ตามราคาตลาด (MC)
MC = การหมุนเวียนในตลาดของโทเค็น (อุปทานหมุนเวียน) X ราคาตลาดปัจจุบันของโทเค็น = 1,000 X 1 = 1,000
MC แสดงถึงมูลค่าตลาดปัจจุบันของโครงการบล็อคเชน คำนวณโดยการคูณการหมุนเวียนในตลาดของโทเค็นด้วยราคาตลาดปัจจุบัน ซึ่งไม่รวมมูลค่าของโทเค็นที่ถูกล็อก
ความแตกต่างที่ชัดเจนที่สุดระหว่าง FDV และ MC คือ FDV รวมเฉพาะค่าของโทเค็นที่ถูกล็อกเท่านั้น MC สามารถใช้เป็นตัวบ่งชี้เพื่อวัดความต้องการของตลาด มันเหมือนกับตัวชี้วัดอุปทาน เนื่องจากการเพิ่มขึ้นของความต้องการของตลาดสำหรับโทเค็นที่ปลดล็อคมากขึ้นจะทำให้ราคาสูงขึ้น ทำให้ FDV เพิ่มขึ้นตามสัดส่วน
ตัวอย่างเช่น ระดมทุน 250,000 ด้วย 5 ล้าน FDV และขาย FDV 5% หลังจากจดทะเบียน สมมติว่า 1% อยู่ในการหมุนเวียน และมูลค่าตามราคาตลาดคือ 1 ล้าน แต่จริง ๆ แล้ว FDV มีจำนวนถึง 100 ล้าน เนื่องจากนักลงทุนเริ่มต้นได้รับผลตอบแทน 20 เท่า จึงมีแรงขายจำนวนมากหากนักลงทุนเริ่มต้นเหล่านั้นปลดล็อกโทเค็น กล่าวคือ มันไม่มีเหตุผลหาก FDV มีขนาดใหญ่กว่า MC ณ เวลาที่ปลดล็อก เนื่องจากอาจทำให้เกิดการขายจำนวนมากและราคาตกลงอย่างมาก สิ่งนี้อธิบายถึงการแก้ไขที่ชัดเจนของ DeFi ในปีที่ผ่านมา ซึ่งแย่กว่าประสิทธิภาพของตลาด crypto ทั้งหมด เนื่องจากโครงการ DeFi ส่วนใหญ่ถูกสร้างขึ้นผ่านการจัดหาเงินทุน และราคาจะลดลงเมื่อโทเค็นถูกปลดล็อค
2.ล็อคค่าทั้งหมด (TVL)
TVL หมายถึงสินทรัพย์สภาพคล่องของโปรโตคอล DeFi ซึ่งระบุจำนวนโทเค็นทั้งหมดที่ถูกล็อคอยู่ในกลุ่มทุน ยิ่ง TVL สูง ยิ่งระดมทุนได้มาก ศักยภาพของโครงการก็จะยิ่งมากขึ้นเท่านั้น เราสามารถเข้าใจข้อมูล เช่น การเปลี่ยนแปลงใน TVL และการไหลเข้าและออกล่าสุดของโทเค็นที่ถูกล็อคของโปรโตคอล DeFi บน DeFi Llama
ตัวบ่งชี้ TVL สามตัวที่ใช้กันทั่วไป:
Total Locked Value (TVL): ยิ่ง TVL สูง โปรโตคอล DeFi ก็ยิ่งดี
Market Cap (Mcap) / TVL: ยิ่งอัตราส่วนต่ำ ตลาดยิ่งมีศักยภาพมากขึ้น
ปริมาณการซื้อขาย (VOL) / TVL: ยิ่งอัตราส่วนสูง ผลตอบแทนยิ่งดี
3.โปรโตคอล รายรับ (ความสามารถในการทำกำไร)
รายได้หมายถึงค่าธรรมเนียมทั้งหมดที่ผู้ใช้จ่าย ในขณะที่รายได้ของโปรโตคอลคือส่วนที่จ่ายให้กับผู้ถือโทเค็นของจำนวนเงินทั้งหมดที่ผู้ใช้จ่ายให้กับโปรโตคอล เมื่อคำนวณรายได้โปรโตคอล เราควรพิจารณากลยุทธ์ทางธุรกิจของโครงการต่างๆ เพื่ออธิบายเพิ่มเติม เราจะใช้ NFTs (โทเค็นที่ไม่สามารถทำงานร่วมกันได้) เป็นตัวอย่าง:
เล่นเพื่อรับ: Axie Infinity
Axie Infinity เกมที่ใช้ Ethereum ขับเคลื่อนด้วย Ethereum เป็นเกมเทิร์นเบสบนบล็อกเชนที่เปิดตัวโดยสตูดิโอชาวเวียดนาม Sky Mavis ในปี 2561 ผู้ใช้จะได้รับโทเค็นการกำกับดูแลโดยการต่อสู้กับผู้เล่นอื่นและทำภารกิจให้สำเร็จ เกมนี้ได้รับความนิยมจาก Play-to-Earn (P2E) จากข้อมูลของ CryptoSlam ซึ่งเป็นเว็บไซต์วิเคราะห์ NFT ยอดขายของ Axie Infinity นั้นเกิน 1 พันล้านดอลลาร์ ทำให้เป็นเกมบล็อกเชนที่ใช้ NFT เกมแรกที่มียอดขายเกิน 1 พันล้านดอลลาร์ รายได้จากการขาย NFT ที่สูงของโครงการยังเป็นตลาดหลัก
100% ของรายได้จากโปรโตคอล Axie Infinity จะมอบให้กับผู้ถือโทเค็น ในทางเทคนิค รายได้ของโปรโตคอลและมูลค่าโทเค็นจะเปลี่ยนแปลงในสัดส่วนที่เท่ากัน เมื่อเปรียบเทียบรายได้ของโปรโตคอลหรืออัตราส่วน PE จำเป็นต้องเข้าใจวิธีการทำงานของโครงการ

โมเดล P2E ได้รับความนิยมอย่างล้นหลามในเกมที่ใช้ NFT ซึ่งผู้เล่นสามารถสะสมรางวัล NFT และสามารถถอนทรัพย์สินในโลกแห่งความเป็นจริงได้
ย้ายเพื่อรับรายได้: STEPN
การออกแบบของเกม STEPN ใช้โมเดล dual-token + NFT ของ Axie Infinity มันมีกลไกโทเค็นคู่ ระบบสืบพันธุ์ และระบบพลังงาน รวมถึงโทเค็นเกม GST (โทเค็นสีเขียว Satoshi) โทเค็นการกำกับดูแล GMT (โทเค็น Green Metaverse) และรองเท้าผ้าใบ NFT
STEPN เชื่อมต่อ Web3 กับโลกแห่งความจริงและมอบแพลตฟอร์มให้ผู้ใช้สร้างรายได้ด้วยการวิ่งด้วยรองเท้าเสมือนจริง
ผู้ก่อตั้งทั้งสองได้ร่างต้นแบบและแนวคิดของโครงการในชั่วข้ามคืน ในโมเดลที่ไม่ซ้ำใครนี้ ผู้ถือ NFT รองเท้าผ้าใบเสมือนสามารถรับรางวัลโทเค็นโดยทำภารกิจให้สำเร็จ กว่าหนึ่งเดือนหลังจากการก่อตั้ง STEPN ได้อันดับที่สี่ใน Solana Ignition Hackathon Gaming Track และได้รับเงินสนับสนุน 5 ล้านเหรียญสหรัฐจาก Sequoia ไม่นานหลังจากเปิดตัวในเดือนธันวาคม 2021
ในช่วงต้นเดือนเมษายน STEPN รายงานรายรับ 26 ล้านดอลลาร์ในไตรมาสแรก มีการดาวน์โหลดแอปมากกว่า 1 ล้านครั้งทั่วโลก และมีมูลค่าตลาดประมาณ 1 พันล้านดอลลาร์ และรับประกันการลงทุนจาก Binance จากข้อมูลออนไลน์บน Dune พบว่ารองเท้าผ้าใบ NFT ประมาณ 4,000~5,000 คู่เข้ามาเกือบทุกวันในสัปดาห์ในช่วงปลายเดือนเมษายน
ณ เดือนพฤษภาคม 2565 STEPN มีผู้ใช้งานรายวัน (DAU) 800,000 ราย และผู้ใช้งานรายเดือน (MAU) 3 ล้านราย จากข้อมูลของ TechCrunch หนังสือพิมพ์ออนไลน์ที่เน้นเรื่องเทคโนโลยีขั้นสูงและบริษัทสตาร์ทอัพ รายได้จากแพลตฟอร์มรายวันของ STEPN อยู่ที่ประมาณ 3 ล้านเหรียญสหรัฐถึง 5 ล้านเหรียญสหรัฐ โดยรายได้ต่อเดือนสูงถึง 10 ล้านเหรียญสหรัฐ
ข้อมูลดังกล่าวแสดงรายได้จากโปรโตคอลจำนวนมากของ STEPN ซึ่งมากเกินกว่ารายได้ของบริษัทยูนิคอร์นอื่นๆ ในภาค DeFi, GameFi และแม้แต่ Web3 ในระยะแรก GMT ยังแสดงให้เห็นประสิทธิภาพที่ยอดเยี่ยม โดยเพิ่มขึ้น 40 เท่าภายใน 50 วัน จาก 0.1 ดอลลาร์ในวันที่ 10 มีนาคม เมื่อเปิดตัวครั้งแรกเป็น 4 ดอลลาร์ซึ่งสูงสุดเมื่อวันที่ 30 เมษายน ข้อมูลพื้นฐานของโปรโตคอลนั้นดีและนักลงทุนมีความกระตือรือร้นอย่างมากในตลาดกระทิงนี้ ซึ่งทั้งสองอย่างนี้กำลังเพิ่มระดับราคาโทเค็น เป็นตัวอย่างที่ดีให้เราได้เรียนรู้อย่างแน่นอน อย่างไรก็ตาม จากการที่เฟดประกาศขึ้นอัตราดอกเบี้ย เงินร้อนไหลออก แนวโน้มตลาดเปลี่ยนไป MAU ลดลง และราคา GMT ลดลง
ถ้าดูแค่ปัจจัยพื้นฐานก็เป็นโอกาสในการซื้อที่ดีจริง ๆ แต่จุดขายตัดสินใจยาก นอกเหนือจากการวิเคราะห์ปัจจัยพื้นฐานแล้ว สิ่งสำคัญอย่างยิ่งคือต้องใช้กลยุทธ์การเข้าและออกที่เหมาะสม รวมถึงวินัยในการเทรด

เครื่องมือวิเคราะห์พื้นฐาน
อีเทอร์สแกน
รายละเอียดการทำธุรกรรมสามารถเข้าถึงได้สำหรับทุกคนเพื่อตรวจสอบ blockchains ในบรรดาเบราว์เซอร์บล็อกเชนที่หลากหลาย เรายกตัวอย่าง Etherscan ซึ่งเป็นโปรแกรมสำรวจบล็อกเชน Ethereum ชั้นนำ ซึ่งกระแสเงินทุนของแต่ละธุรกรรมบนเชนนั้นโปร่งใสและตรวจสอบย้อนกลับได้
ใช้โทเค็น SHIBA INU เป็นตัวอย่าง เราสามารถดูได้จากด้านล่างการจัดสรรโทเค็นและที่อยู่กระเป๋าเงินของผู้ถือ รวมถึงการจัดหาโทเค็นทั้งหมดและจำนวนผู้ถือทั้งหมด

โทเค็นเทอร์มินัล
Token Terminal สร้างมาตรฐานข้อมูล cryptocurrency โดยอ้างอิงจากตัวบ่งชี้ตลาดหุ้นทางการเงินแบบดั้งเดิม ช่วยให้นักลงทุนสามารถตรวจสอบมูลค่าของ blockchains และแอพพลิเคชั่นแบบกระจายศูนย์ต่างๆ ได้อย่างง่ายดาย ตัวชี้วัดที่มีอยู่ใน Token Terminal ได้แก่: มูลค่าตลาดรวม, มูลค่าตลาดหมุนเวียน, อัตราส่วนราคาต่อการขาย, อัตราส่วนราคาต่อกำไร, ปริมาณการซื้อขายของโทเค็น, มูลค่ารวมที่ถูกล็อค, ปริมาณสินค้าโภคภัณฑ์ทั้งหมด, รายได้, รายได้โปรโตคอล (ผู้ถือโทเค็น) , ต้นทุนและค่าใช้จ่าย , รายได้รวม ฯลฯ โดยจะให้ข้อมูลโครงการที่เป็นต้นฉบับและดาวน์โหลดได้ ทำให้ทุกคนสามารถทำการวิเคราะห์ข้อมูลได้อย่างรวดเร็วและแม่นยำด้วยความช่วยเหลือของตัวกรองและฟังก์ชันการแสดงผลที่หลากหลาย
ในตัวอย่าง Axie Infinity ที่กล่าวถึงข้างต้น คุณสามารถดูเมตริกต่างๆ ที่มี รวมถึงมูลค่าตลาดรวม มูลค่าตลาดหมุนเวียน อัตราส่วนราคาต่อกำไร และปริมาณการซื้อขายของโทเค็น เพื่อให้ผู้ใช้ทำการวิเคราะห์การแข่งขัน การวิเคราะห์ข้อมูล และเมตริกหลายรายการ การวิเคราะห์โครงการที่คล้ายกัน

ดูนวิเคราะห์
Dune Analytics เป็นเว็บไซต์วิเคราะห์บล็อกเชนที่มีประสิทธิภาพและฟรี ซึ่งคุณสามารถดึงข้อมูลจากบล็อกเชน Ethereum ด้วย SQL (ภาษาโปรแกรมฐานข้อมูล) หรือเพียงแค่คัดลอกโปรแกรม SQL จากผู้อื่นหรือค้นหาโทเค็นโดยตรง ด้วยข้อมูลคุณสามารถสร้างแผนภูมิภาพได้ ทำให้กระบวนการค้นหาข้อมูลง่ายขึ้น ใช้งานง่าย และแสดงผลลัพธ์ที่เห็นภาพมากขึ้น
ในตัวอย่างต่อไปนี้ เราสามารถใช้ Dune เพื่อสืบค้นและวาดแผนภูมิที่แสดงจำนวนผู้ใช้ใหม่ STEPN ที่มีทุกวัน และแผนภูมิแนวโน้มราคาสำหรับช่วงเวลาที่กำหนด เป็นต้น

ข่าวการตลาด
หมายถึงข่าวต่าง ๆ ที่ส่งผลกระทบต่อตลาดในทางลบหรือทางบวก ในตลาดเศรษฐกิจจริง สภาพแวดล้อมโดยรวมจะไม่เพียงส่งผลกระทบต่อตลาดหุ้นเท่านั้น แต่ยังส่งผลต่อสกุลเงินดิจิทัลด้วยเนื่องจากการแลกเปลี่ยนกระแสการเงิน ปัจจัยที่มีอิทธิพลต่อตลาดเศรษฐกิจใน crypto ได้แก่ การอัปเกรดครั้งใหญ่ การจดทะเบียนในตลาดแลกเปลี่ยน ช่องโหว่ของสัญญา ฯลฯ ช่วงเวลาที่สะดุดตาที่สุดใน crypto คือ Bitcoin Halving Cycle สี่ปี การลดลงแต่ละครั้งจะทำให้เกิดช่วงเวลาใหม่ของการกลับตัวจากจุดต่ำสุด ดังนั้นจึงสามารถใช้เป็นข่าวอ้างอิงสำหรับตลาดทั้งหมดได้
[รอบ Bitcoin Halving สี่ปี]
การเปิดตัว Bitcoin: 3 มกราคม 2552 รางวัลบล็อค: 50 BTC
การลดลงครึ่งหนึ่งครั้งแรก: 28 พฤศจิกายน 2555 รางวัลบล็อค: 25 BTC
การลดลงครึ่งหลัง: 9 กรกฎาคม 2559 รางวัลบล็อค: 12.5 BTC
การลดลงครึ่งหนึ่งครั้งที่สาม: 12 พฤษภาคม 2020 รางวัลบล็อค: 6.25 BTC
การลดจำนวนลงครั้งที่สี่: กำหนดในปี 2024 รางวัลบล็อค: 3.125 BTC

โดยการซื้อขายดู
ยอดคงเหลือในการแลกเปลี่ยน
โดยทั่วไปแล้ว การเทขายจำนวนมากมีโอกาสน้อยที่จะเกิดขึ้นในตลาดกระทิง นักลงทุนวาฬส่วนใหญ่ที่ถือครองเงินทุนจำนวนมากจะเก็บสกุลเงินไว้ในกระเป๋าเงินเย็นเพื่อความปลอดภัย ขณะที่อยู่ในตลาดหมี นักลงทุนวาฬอาจขายการถือครองในปริมาณมากเมื่อใดก็ได้เพื่อไม่ให้สูญเสียเงิน ในเวลานี้ หากดุลการแลกเปลี่ยนเพิ่มขึ้น อาจเป็นสัญญาณเตือนถึงการขายออกและอาจทำให้ราคาร่วงลง
ประวัติการทำธุรกรรมของ Whale Wallet
วิธีโดยตรงในการค้นหาธุรกรรมกระเป๋าเงิน Whale คือผ่าน Whale Alert ซึ่งเป็นเว็บไซต์รวบรวมข้อมูลและการวิเคราะห์ ซึ่งคุณสามารถตรวจสอบธุรกรรมกระเป๋าเงิน Whale ของเหรียญต่าง ๆ และค้นหาว่าเหรียญใดอยู่ระหว่างการทำธุรกรรมจำนวนมาก อย่างไรก็ตาม นี่เป็นเพียงสัญญาณในการทำนายแนวโน้มในอนาคตเท่านั้น และไม่ควรใช้เป็นคำแนะนำในการลงทุนโดยตรง

โดย Whale Alert ทวิตเตอร์
ข้อดีและข้อเสียของการวิเคราะห์พื้นฐานของ Cryptocurrency
ข้อดี
ช่วยหาจุดเปลี่ยนเมื่อเทรนด์เปลี่ยน
อำนวยความสะดวกในการรับข้อมูลแบบเรียลไทม์และการเปลี่ยนแปลงของเทรนด์ในทันที
ช่วยระบุเป้าหมายการลงทุนที่เหมาะสม
หลีกเลี่ยงการเทขายอย่างไม่มีเหตุผลซึ่งเกิดจากความตื่นตระหนก
ข้อเสีย
ข้อมูลอาจถูกปลอมแปลง
ไม่มีคำแนะนำและข้อมูลที่เป็นมาตรฐานและครอบคลุมซึ่งเปิดเผยต่อสาธารณะ ทำให้ยากต่อการระบุข้อมูลที่แท้จริง
ข้อมูลบางอย่างที่ทีมงานโครงการให้ไว้อาจถูกซ่อนหรือเป็นเท็จ
การรวบรวมและวิเคราะห์ข้อมูลใช้เวลานานและใช้แรงงานมาก
บทสรุป
เครื่องมือวิเคราะห์พื้นฐานที่ออกแบบมาสำหรับตลาดการเงินแบบดั้งเดิมไม่สามารถใช้ได้กับตลาดเกิดใหม่อีกต่อไป เพื่อตอบสนองต่อสิ่งนี้ เครื่องมือวิเคราะห์เสริมต่างๆ จึงถูกสร้างขึ้น ข้อมูลทั้งหมดจะถูกบันทึกและเผยแพร่สู่สาธารณะบนบล็อกเชนเนื่องจากมีลักษณะเปิด อย่างไรก็ตามการใช้เครื่องมือเสริมเหล่านี้ยังคงอาศัยแอปพลิเคชันต่างๆ ในการรวบรวมข้อมูล
แหล่งข้อมูลของแพลตฟอร์มการวิเคราะห์ทั้งหมดอาจไม่ถูกต้องสมบูรณ์ และข่าวอาจถูกปลอมแปลงได้ง่าย โดยเฉพาะอย่างยิ่งเมื่อนักลงทุน crypto ส่วนใหญ่กระจายอยู่ทั่วโลก ทำให้เป็นจุดบอดด้านกฎระเบียบ แม้ว่าจะมีข้อพิพาทเกิดขึ้น มันเป็นเรื่องยากมากที่จะแก้ไขผ่านการฟ้องร้อง
ปัจจุบัน เราไม่มีโมเดลข้อมูลที่ซับซ้อนและเกณฑ์การประเมินสำหรับการวิเคราะห์พื้นฐานของสกุลเงินดิจิทัลเช่นเดียวกับการเงินแบบดั้งเดิม ยังมีช่องว่างอีกมากสำหรับการปรับปรุงเครื่องมือ อย่างไรก็ตาม หากนักลงทุนสามารถตัดสินใจลงทุนได้อย่างมีประสิทธิภาพโดยมีความเป็นไปได้สูงที่จะได้กำไรจากการสำรวจปัจจัยพื้นฐานของโครงการและใช้รูปแบบการวิเคราะห์และเกณฑ์การประเมินที่ดีกว่า การวิเคราะห์ปัจจัยพื้นฐานยังคงเป็นวิธีที่ดีในการประเมิน
โครงการ Cryptocurrency เพิ่งเฟื่องฟูหลังปี 2020 ตั้งแต่นั้นเป็นต้นมา สถานการณ์การใช้งานที่หลากหลายและสร้างสรรค์ได้เกิดขึ้น อย่างไรก็ตาม ตลาดคริปโตมีความผันผวนอย่างมาก โดยมีความเสี่ยงและโอกาสอยู่ร่วมกัน การออกแบบโมเดลการวิเคราะห์ปัจจัยพื้นฐานที่กำหนดเองจะช่วยให้คุณตัดสินใจลงทุนได้อย่างมีระเบียบวินัยมากขึ้น เนื่องจากคุณสมบัติการลงทุน crypto ที่มีความเสี่ยงสูงและให้ผลตอบแทนสูง รูปแบบการวิเคราะห์ที่ออกแบบมาอย่างดีจะทำให้กลยุทธ์การลงทุนของคุณดีขึ้น
บทความที่เกี่ยวข้อง

Magic Eden คืออะไร: ตลาด NFT ของ Solana

ศึกษาด้วยตัวคุณเอง (DYOR)?

โซลานาคืออะไร?
การวิเคราะห์ปัจจัยพื้นฐานคืออะไร?

การวิเคราะห์พื้นฐานของ Cryptocurrencies คืออะไร?
การวิเคราะห์ปัจจัยพื้นฐานคืออะไร?
Cryptocurrencies และการวิเคราะห์พื้นฐาน
สามเมตริกพื้นฐาน
สามตัวบ่งชี้ที่สำคัญ
เครื่องมือวิเคราะห์พื้นฐาน
ข่าวการตลาด
ข้อดีและข้อเสียของการวิเคราะห์พื้นฐานของ Cryptocurrency
บทสรุป
การวิเคราะห์พื้นฐานของ Cryptocurrencies คืออะไร?
โครงการ Cryptocurrency เพิ่งเฟื่องฟูหลังปี 2020 ตั้งแต่นั้นเป็นต้นมา สถานการณ์การใช้งานที่หลากหลายและสร้างสรรค์ได้เกิดขึ้น อย่างไรก็ตาม ตลาดคริปโตมีความผันผวนอย่างมาก โดยมีความเสี่ยงและโอกาสอยู่ร่วมกัน การออกแบบโมเดลการวิเคราะห์ปัจจัยพื้นฐานที่กำหนดเองจะช่วยให้คุณตัดสินใจลงทุนได้อย่างมีระเบียบวินัยมากขึ้น เนื่องจากคุณสมบัติการลงทุน crypto ที่มีความเสี่ยงสูงและให้ผลตอบแทนสูง รูปแบบการวิเคราะห์ที่ออกแบบมาอย่างดีจะทำให้กลยุทธ์การลงทุนของคุณดีขึ้น ซื้อขาย. คุณอาจเคยได้ยินคำว่า “หนึ่งวันใน crypto เท่ากับสิบปีในตลาดการเงินแบบดั้งเดิม” นี่เป็นเพราะกฎ “จำกัดขึ้น-จำกัดลง” ในตลาดหุ้นป้องกันทั้งผลกำไรที่มากเกินไปและการขาดทุนที่เพิ่มขึ้น เมื่อการเปลี่ยนแปลงราคาเกินขีดจำกัด จะทำให้การซื้อขายหยุดลง อย่างไรก็ตาม ในตลาดคริปโตเคอเรนซีเกิดใหม่ ไม่มีการจำกัดราคาหรือเวลาซื้อขาย คุณสามารถแลกเปลี่ยน crypto ได้ทุกนาที อย่างไรก็ตาม ศักยภาพมหาศาลในการทำกำไรนั้นมาพร้อมกับความเสี่ยงที่สูงเสมอ ภายใต้กฎหมาย มีวิธีที่เหมาะสมที่สุดที่นักลงทุนสามารถใช้ในการตัดสินใจลงทุนที่ดีที่สุดได้หรือไม่?
การวิเคราะห์ปัจจัยพื้นฐานคืออะไร?
ในตลาดการเงินแบบดั้งเดิม นักลงทุนต้องตัดสินใจเพื่อตอบสนองต่อการเปลี่ยนแปลงของตลาด การตัดสินใจที่เหมาะสมทุกครั้งเกิดจากการใช้วิธีการวิเคราะห์ที่เหมาะสม โดยพื้นฐานแล้ว วิธีการวิเคราะห์สามารถแบ่งออกได้เป็นสามประเภท ได้แก่ การวิเคราะห์ปัจจัยพื้นฐาน ทางเทคนิค และต้นทุนตำแหน่ง การวิเคราะห์ปัจจัยพื้นฐานในตลาดหุ้นแบบดั้งเดิมคือการทำความเข้าใจสถานะทางการเงินและความสามารถในการทำกำไรของบริษัทผ่านการวิเคราะห์งบการเงินสามฉบับและตัวบ่งชี้หลักสี่ตัว ดังนั้นการพิจารณาว่าสมควรได้รับการลงทุนระยะยาวหรือไม่
งบการเงิน 3 งบการเงินข้างต้นประกอบด้วย งบกำไรขาดทุน (เพื่อพิจารณาว่าบริษัทมีกำไรสุทธิหรือไม่) งบดุล (เพื่อตรวจสอบสินทรัพย์และหนี้สินของบริษัท) และงบกระแสเงินสด (เพื่อดูว่าเงินสดมีสภาพคล่องสูงเพียงใด บริษัทเป็นเจ้าของ)
ตัวบ่งชี้ทั้งสี่ประกอบด้วย Earnings Per Share (EP) ที่แสดงผลกำไรที่แต่ละหุ้นนำมา อัตราส่วนราคาต่อกำไร (PE) ที่คาดการณ์ระยะเวลาที่หุ้นจะไปถึงจุดคุ้มทุน และอัตราส่วนราคาตามบัญชี (PB) ที่ คำนวณอัตรากำไรขั้นต้นจากการดำเนินงานและตัดสินว่าราคาหุ้นยุติธรรมหรือไม่
โดยสรุปแล้ว การวิเคราะห์ปัจจัยพื้นฐานเป็นวิธีการที่สำคัญที่สุดที่นักลงทุนใช้ในการประเมินว่าสินทรัพย์มีมูลค่าสูงเกินไปหรือต่ำกว่ามูลค่าทั้งในตลาดหุ้นแบบดั้งเดิมและตลาดสกุลเงินดิจิทัลที่เกิดขึ้นใหม่
Cryptocurrencies และการวิเคราะห์พื้นฐาน
แตกต่างจากบริษัทจดทะเบียนในตลาดหุ้น โครงการ crypto ไม่มีงบการเงินรายไตรมาสสำหรับนักลงทุน ดังนั้น งบการเงินหลักสามรายการและตัวบ่งชี้หลักสี่รายการจึงใช้ไม่ได้ในตลาดเกิดใหม่ crypto
เนื่องจากลักษณะการกระจายอำนาจของ cryptocurrencies จึงไม่มีมาตรการสากลที่สามารถใช้กับพื้นที่ crypto ทั้งหมดได้ เนื่องจากคำบอกเล่าที่ดูเหมือนน่าเชื่อถืออาจเป็นของปลอม นักลงทุนจึงต้องเรียนรู้ที่จะระบุข้อมูลจริงและพิจารณาว่าแหล่งข้อมูลนั้นเชื่อถือได้หรือไม่ บัญชี Twitter หรือกลุ่ม Telegram ที่คุณติดตามอาจเผยแพร่ข่าวที่ไม่ได้รับการยืนยัน และจำนวนที่อยู่ที่ใช้งานบนบล็อกเชนที่เพิ่มขึ้นก็อาจเป็นข้อมูลปลอมได้เช่นกัน
แล้วอะไรคือตัวบ่งชี้และเครื่องมือที่เหมาะสมที่ทำงานได้ดีที่สุดกับข่าวตลาดเพื่อทำการวิเคราะห์ปัจจัยพื้นฐานที่ดีที่สุดเท่าที่จะเป็นไปได้เพื่ออำนวยความสะดวกในการตัดสินใจในตลาด crypto?
ด้านล่างนี้คือการวิเคราะห์โดยละเอียดของเมตริกพื้นฐานสามตัว ตัวบ่งชี้หลักสามตัว เครื่องมือวิเคราะห์ และข่าวการตลาดของการวิเคราะห์พื้นฐานของสกุลเงินดิจิทัล
สามเมตริกพื้นฐาน
1.ตัวชี้วัดบนเครือข่าย
เมตริกบนเครือข่ายหมายถึงข้อมูลที่สามารถใช้สังเกตบล็อกเชนเป็นตัวบ่งชี้ในการตัดสินแนวโน้มของตลาด อย่างไรก็ตาม การรวบรวมข้อมูลของโหนดเดียวเพียงอย่างเดียวนั้นใช้เวลานานและใช้แรงงานมาก นักลงทุนอาจอ้างอิงข้อมูลที่จัดทำโดยเว็บไซต์ที่ออกแบบมาโดยเฉพาะสำหรับการตัดสินใจลงทุน หรือดึงข้อมูลที่จำเป็นจาก API (Application Programming Interfaces)
จำนวนธุรกรรม
สามารถใช้เป็นมาตรการง่ายๆ ในการประเมินกิจกรรมเครือข่าย จากการสังเกตกิจกรรมการทำธุรกรรมเป็นระยะเวลาหนึ่ง เราสามารถเห็นการเปลี่ยนแปลงของจำนวนธุรกรรมในห่วงโซ่ อย่างไรก็ตาม สิ่งนี้ไม่ได้รับประกันว่าข้อมูลทั้งหมดเป็นข้อมูลจริงและไม่ได้เพิ่มขึ้นเทียมจากการโอนสินทรัพย์ระหว่างกระเป๋าเงินต่างๆ ของนักลงทุนรายเดียวกัน คุณควรให้ความสนใจเป็นพิเศษกับการฉ้อโกงข้อมูล
ปริมาณธุรกรรม
ซึ่งแตกต่างจากจำนวนธุรกรรมที่กล่าวถึงข้างต้น ปริมาณธุรกรรมหมายถึงมูลค่ารวมที่ซื้อขายในช่วงเวลาที่แน่นอน ปริมาณธุรกรรมทั้งหมดบนเครือข่ายเท่ากับจำนวนธุรกรรมคูณด้วยจำนวนธุรกรรมแต่ละรายการ
ที่อยู่ที่ใช้งานอยู่
หมายถึงที่อยู่ blockchain ที่ใช้งานในช่วงเวลาที่กำหนด ท่ามกลางวิธีการต่างๆ ในการตัดสินว่าที่อยู่ที่ทำงานอยู่หรือไม่ เรามักจะติดตามที่อยู่ที่ใช้งานทั้งหมดโดยการสังเกตจำนวนที่อยู่ที่ส่งและรับของธุรกรรมบนเครือข่ายแต่ละรายการในช่วงระยะเวลาหนึ่ง และคำนวณผลรวมตามช่วงเวลาปกติ
ชำระค่าธรรมเนียมการทำธุรกรรม
หากบล็อกเชนแออัดและใช้เวลานานขึ้นในการทำธุรกรรม เราสามารถเร่งการทำธุรกรรมโดยเพิ่มค่าธรรมเนียมการทำธุรกรรม หากบล็อกเชนดำเนินไปอย่างราบรื่นและใช้เวลาไม่นานในการทำธุรกรรม เราสามารถลดความเร็วการทำธุรกรรมและประหยัดค่าธรรมเนียมการทำธุรกรรมได้ จากค่าธรรมเนียมการทำธุรกรรม เราสามารถเห็นความต้องการของนักเทรดโดยตรงสำหรับบล็อคเชนเฉพาะ ยิ่งความต้องการสูง บล็อกเชนก็ยิ่งแออัด และค่าธรรมเนียมการทำธุรกรรมก็จะยิ่งสูงขึ้น
อัตราแฮช (พลังการคำนวณ) และจำนวนเงินเดิมพัน
ในระบบบัญชีแยกประเภทแบบกระจายของบล็อกเชน จำเป็นต้องมีกลไกบางอย่างเพื่อกำหนดลำดับการทำงานของโหนดเครือข่าย กลไกนี้ขึ้นอยู่กับการคำนวณโหนดเรียกว่าอัลกอริทึมฉันทามติซึ่งมีความสำคัญมากต่อความเสถียรและความปลอดภัยของบล็อกเชน
อัลกอริธึมหลักที่สอดคล้องกันมากที่สุดอย่างหนึ่งคือ Proof of Work (PoW) สำหรับ Bitcoin จะใช้อัตราแฮช เช่น พลังการประมวลผล - พลังการประมวลผลทั้งหมดของการขุดหรือประมวลผลธุรกรรมบนบล็อกเชน ธุรกรรมบนเครือข่ายถูกเชื่อมโยงเข้าด้วยกันและไม่สามารถเปลี่ยนแปลงได้ ยกตัวอย่างการโจมตี 51% ทั่วไป หากแฮ็กเกอร์ต้องการยุ่งเกี่ยวกับหรือปลอมแปลงข้อมูลบล็อกเชน พวกเขาต้องควบคุมมากกว่า 51% ของโหนดเครือข่ายทั้งหมดเพื่อให้เป็นไปได้ ดังนั้นยิ่งอัตราแฮชสูง ความยากของการโจมตี 51% ก็จะยิ่งสูงขึ้น
อัลกอริธึมที่เป็นเอกฉันท์ทั่วไปอีกอย่างหนึ่งคือ Proof of Stake (PoS) โดยพื้นฐานแล้ว ต้องใช้สินทรัพย์ในการเดิมพันเพื่อเข้าร่วมการตรวจสอบการบล็อก เราสามารถบอกความต้องการของตลาดได้โดยการตรวจสอบจำนวนการเดิมพัน
2.ตัวชี้วัดของโครงการ
เมตริกโครงการใช้เพื่อประเมินประสิทธิภาพของทีมงานโครงการและผลลัพธ์ของโครงการในรูปแบบต่างๆ
whitepaper
สมุดปกขาวเป็นเหมือนหนังสือชี้ชวนของหุ้น แต่เน้นที่การวิจัยและข้อมูลทางเทคนิคที่เกี่ยวข้องกับโครงการมากกว่า ซึ่งเป็นช่องทางให้สาธารณชนเข้าใจว่าโครงการทำงานอย่างไร เช่นเดียวกับภาพที่เห็นและการจัดสรรทรัพยากรเบื้องต้น โดยเฉพาะอย่างยิ่ง เอกสารไวท์เปเปอร์ครอบคลุมถึง:
- เทคโนโลยี
- ใช้กรณี
- แผนงานสำหรับการอัปเกรดหรือคุณสมบัติใหม่
- การจัดหาและการออกโทเค็น
ทีม
เนื่องจากทีมงานโครงการ cryptocurrency ส่วนใหญ่จะโพสต์ข้อมูลของสมาชิกในทีมของตนบน GitHub การรับข้อมูลที่เกี่ยวข้องจึงสะดวกมาก GitHub เป็นแพลตฟอร์มโอเพ่นซอร์สที่ใช้บ่อยที่สุดสำหรับนักพัฒนาเนื่องจากมีต้นทุนต่ำ ผู้ใช้ที่ลงทะเบียนของแพลตฟอร์มนี้สามารถอัปโหลดไฟล์และข้อมูลไปยังบัญชีของพวกเขา ทำให้ทุกคนสามารถเข้าถึงได้แบบสาธารณะ ดังนั้นจึงเป็นไปได้ที่จะรู้ว่าทีมมีทักษะที่จำเป็นในการทำให้โครงการเป็นจริง หรือประเมินว่าทีมมีประวัติที่น่าอับอายหรือไม่โดยการประเมินประสบการณ์ในอดีตของสมาชิกที่เปิดเผยและอ่านข่าวที่เกี่ยวข้อง
คู่แข่ง
หลังจากทำการค้นคว้าอย่างเพียงพอเกี่ยวกับเอกสารไวท์เปเปอร์และทีมแล้ว คุณสามารถวิเคราะห์เปรียบเทียบคู่สัญญาของแอปพลิเคชันที่คล้ายคลึงกันได้ เมื่อเปรียบเทียบกับผลิตภัณฑ์และโครงการคู่แข่งที่คุณสนใจด้วยตัวบ่งชี้หลายตัว คุณสามารถประเมินได้ว่าโครงการสามารถเปลี่ยนได้ง่ายหรือไม่
Tokenomics และการกระจายโทเค็นเริ่มต้น
จำเป็นต้องตรวจสอบว่าโทเค็นมีกรณีการใช้งานจริง กระแสเงินสดดำเนินการอย่างไร เป็นต้น มูลค่าที่แท้จริงจะมีอยู่ก็ต่อเมื่อโทเค็นมีการใช้งานจริงและได้รับการยอมรับจากตลาด
เราควรพิจารณาปัจจัยสำคัญอีกประการ - วิธีจัดสรรโทเค็นเริ่มต้น หากได้รับการจัดสรรผ่านการเสนอขายเหรียญเริ่มต้น (ICO) หรือ Initial Exchange Offer (IEO) สมุดปกขาวควรระบุเปอร์เซ็นต์ของโทเค็นที่ผู้ก่อตั้งและทีมใช้และเก็บรักษา รวมถึงจำนวนโทเค็นที่มีให้สำหรับนักลงทุน และผ่าน Initial Model Offer (IMO) คุณสามารถดูหลักฐานการประกาศเหมืองบนเครือข่ายที่คุณเคยโพสต์ไว้
บางครั้งควรใช้หลักความน่าเชื่อถือสำหรับเมตริกโครงการ เนื่องจากนักลงทุนสามารถตัดสินได้จากข้อมูลที่เปิดเผยโดยทีมงานเท่านั้น ข้อมูลที่ซ่อนอยู่หรือการเปิดเผยที่ผิดพลาดจะก่อให้เกิดความเสี่ยงที่อาจเกิดขึ้นได้
3. เมตริกทางการเงิน
แตกต่างจากเครื่องมือวิเคราะห์พื้นฐานทางการเงินแบบดั้งเดิมที่ประเมินข้อมูลสาธารณะ เช่น ปริมาณการซื้อขาย ราคา และสภาพคล่อง เมตริกทางการเงินในการเข้ารหัสลับจะเน้นที่ข้อตกลงหรือมาตรการจูงใจ
Market Cap (มูลค่าเครือข่าย)
มูลค่าตลาดเท่ากับโทเค็นหมุนเวียนคูณด้วยราคาโทเค็น Market Cap หมายถึงต้นทุนสมมุติฐาน (ไม่รวม Slippage) ต่อหน่วยของการซื้อโทเค็น ตัวอย่างเช่น หากมีการออกโทเค็น 1 ล้านโทเค็นและราคาซื้อขายคือ 1 ดอลลาร์ มูลค่ารวมตามราคาตลาดคือ 1 ล้านดอลลาร์ ซึ่งสร้างขึ้นจากความว่างเปล่าทั้งหมด มูลค่าตลาดบิดเบี้ยวอย่างเห็นได้ชัด โทเค็นจะไร้ค่าหากความนิยมลดลงและความต้องการลดลงหลังจากผ่านไประยะหนึ่ง
นอกจากความผันผวนของราคาแล้ว จำนวนของโทเค็นที่หมุนเวียนก็ไม่แน่นอนเช่นกัน เนื่องจากโทเค็นอาจถูกทำลายหรือสูญหายในการโอนหรือเนื่องจากกุญแจหาย อย่างไรก็ตาม ส่วนแบ่งการตลาดยังคงถูกใช้เพื่อประเมินศักยภาพในการเติบโตของเครือข่าย นักลงทุนคริปโตบางคนเชื่อว่าเหรียญที่มี Market Cap ขนาดเล็กมีศักยภาพในการเติบโตสูงกว่าเหรียญกระแสหลักอย่าง Bitcoin และ Ethereum
ตัวอย่างมูลค่าตลาดของ Bitcoin: ราคา BTC อยู่ที่ $20,669 และอุปทานหมุนเวียนอยู่ที่ 19,087,475
มูลค่าตลาดรวมในการหมุนเวียนอยู่ที่ประมาณ $394.5 พันล้าน ($20,669 x 19,087,475 BTC = 394,536,772,126)
โดย CoinMarketCap
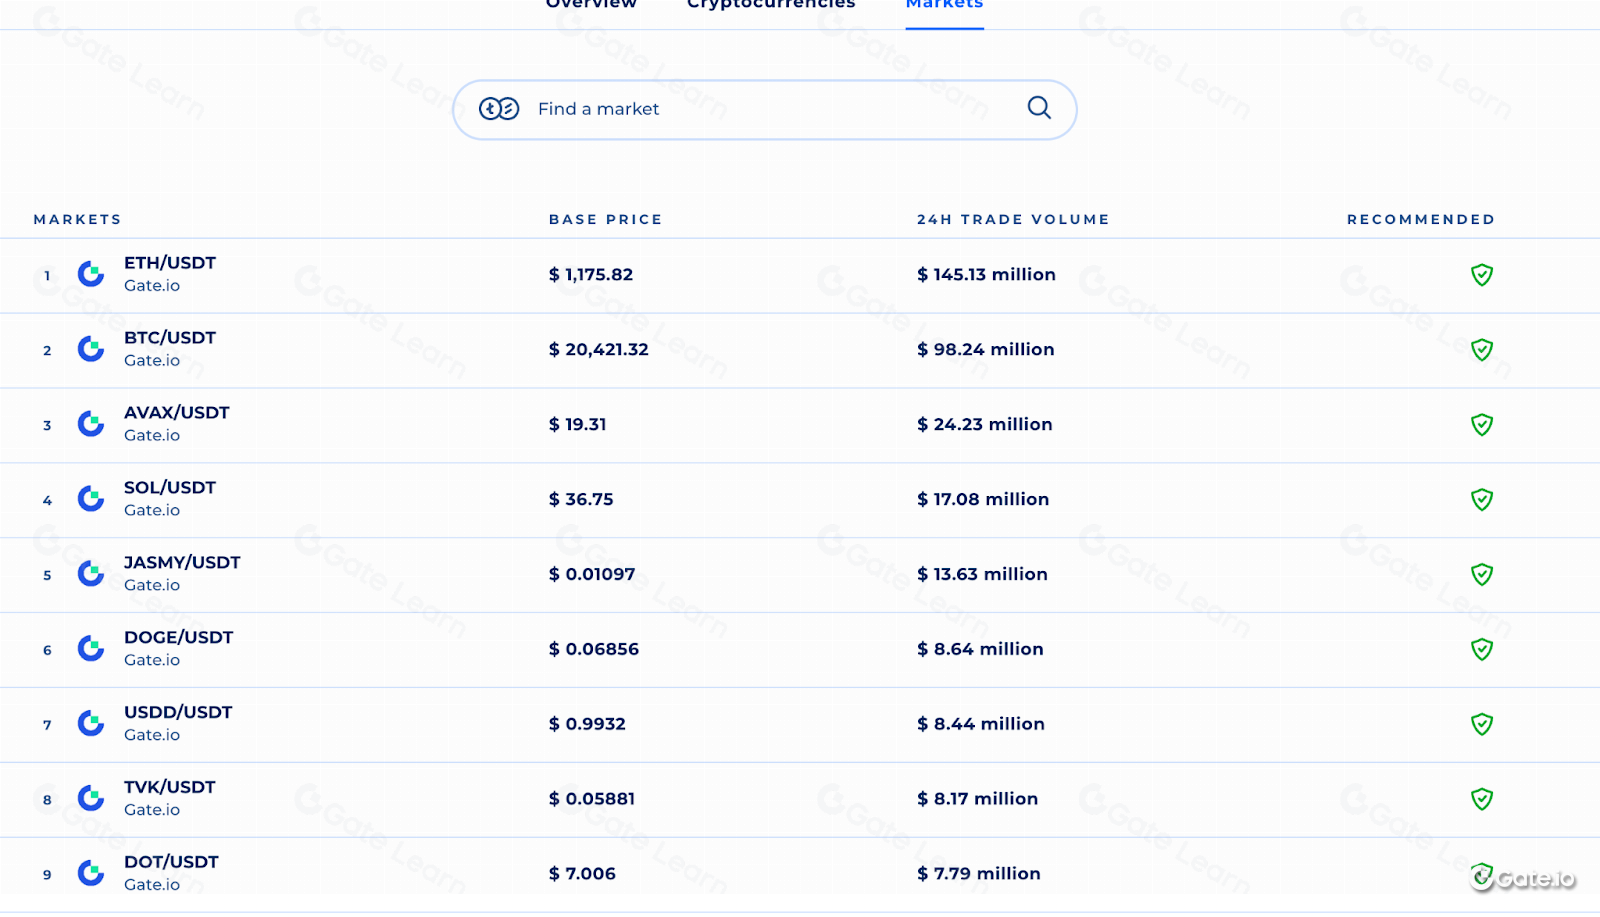
สภาพคล่องและปริมาณการซื้อขาย
สภาพคล่องหมายถึงความเร็วของเงิน ในตลาดที่มีสภาพคล่องสูง การซื้อหรือขายสินทรัพย์ในราคาที่ยุติธรรมทำได้ง่ายและรวดเร็ว ในขณะที่มีสภาพคล่องไม่เพียงพอ สินทรัพย์ไม่สามารถซื้อขายได้ในราคาที่สอดคล้องกับตลาดที่มีประสิทธิภาพ
ปริมาณการซื้อขายเป็นตัวบ่งชี้ที่ช่วยกำหนดสภาพคล่อง แผนภูมิจะบันทึกปริมาณการซื้อขายและมูลค่าการซื้อขายในช่วงเวลาที่กำหนด สภาพคล่องสามารถช่วยกำหนดความต้องการของตลาดได้
รายการตลาด Gate.io และคู่ซื้อขาย - ตามปริมาณ | อันดับเหรียญ
กลไกการจัดหา
กลไกการจัดหาสกุลเงินที่อยู่เบื้องหลังโทเค็นนั้นค่อนข้างสำคัญ อุปทานสูงสุด การไหลเวียนของตลาด และอัตราเงินเฟ้อจะกำหนดผลกระทบทางอ้อมต่อราคา ซึ่งหมายความว่าหากจำนวนโทเค็นเพิ่มขึ้นและความต้องการยังคงเท่าเดิม ราคาซื้อขายจะลดลง
หลังจากช่วงเวลาหนึ่ง โทเค็นบางตัวจะลดจำนวนเหรียญใหม่ที่สร้างขึ้นและลดอุปทานทั้งหมดเพื่อรักษาราคา ดังนั้นจึงสามารถใช้อุปทานเป็นเกณฑ์ในการตรวจสอบว่ามีปัญหาเพิ่มเติมไม่จำกัดหรือไม่ หากเป็นเช่นนั้น จะทำให้เกิดภาวะเงินเฟ้อและราคาต่ำ และสร้างความเสียหายต่อตลาด
สามตัวบ่งชี้ที่สำคัญ
1. Market Capitalization (MC) และ Fully Diluted Valuation (FDV)
(ในตัวอย่างต่อไปนี้ สมมติว่าราคาตลาดปัจจุบันของโทเค็น A คือ $1 อุปทานหมุนเวียนคือ 1,000 และอุปทานสูงสุดคือ 10,000)
การประเมินมูลค่าเต็มปรับลด (FDV)
FDV = ปริมาณสูงสุดของโทเค็น X ราคาตลาดปัจจุบันของโทเค็น = 10,000 X 1 = 10,000
FDV เป็นตัวบ่งชี้ที่สามารถใช้ในการประเมินมูลค่าตลาดในอนาคตของโครงการ นั่นคือหากทีมปลดล็อกโทเค็นทั้งหมดและนำเข้าสู่ตลาด FDV จะแสดงมูลค่าในอนาคตของโครงการในราคาปัจจุบัน
มูลค่าหลักทรัพย์ตามราคาตลาด (MC)
MC = การหมุนเวียนในตลาดของโทเค็น (อุปทานหมุนเวียน) X ราคาตลาดปัจจุบันของโทเค็น = 1,000 X 1 = 1,000
MC แสดงถึงมูลค่าตลาดปัจจุบันของโครงการบล็อคเชน คำนวณโดยการคูณการหมุนเวียนในตลาดของโทเค็นด้วยราคาตลาดปัจจุบัน ซึ่งไม่รวมมูลค่าของโทเค็นที่ถูกล็อก
ความแตกต่างที่ชัดเจนที่สุดระหว่าง FDV และ MC คือ FDV รวมเฉพาะค่าของโทเค็นที่ถูกล็อกเท่านั้น MC สามารถใช้เป็นตัวบ่งชี้เพื่อวัดความต้องการของตลาด มันเหมือนกับตัวชี้วัดอุปทาน เนื่องจากการเพิ่มขึ้นของความต้องการของตลาดสำหรับโทเค็นที่ปลดล็อคมากขึ้นจะทำให้ราคาสูงขึ้น ทำให้ FDV เพิ่มขึ้นตามสัดส่วน
ตัวอย่างเช่น ระดมทุน 250,000 ด้วย 5 ล้าน FDV และขาย FDV 5% หลังจากจดทะเบียน สมมติว่า 1% อยู่ในการหมุนเวียน และมูลค่าตามราคาตลาดคือ 1 ล้าน แต่จริง ๆ แล้ว FDV มีจำนวนถึง 100 ล้าน เนื่องจากนักลงทุนเริ่มต้นได้รับผลตอบแทน 20 เท่า จึงมีแรงขายจำนวนมากหากนักลงทุนเริ่มต้นเหล่านั้นปลดล็อกโทเค็น กล่าวคือ มันไม่มีเหตุผลหาก FDV มีขนาดใหญ่กว่า MC ณ เวลาที่ปลดล็อก เนื่องจากอาจทำให้เกิดการขายจำนวนมากและราคาตกลงอย่างมาก สิ่งนี้อธิบายถึงการแก้ไขที่ชัดเจนของ DeFi ในปีที่ผ่านมา ซึ่งแย่กว่าประสิทธิภาพของตลาด crypto ทั้งหมด เนื่องจากโครงการ DeFi ส่วนใหญ่ถูกสร้างขึ้นผ่านการจัดหาเงินทุน และราคาจะลดลงเมื่อโทเค็นถูกปลดล็อค
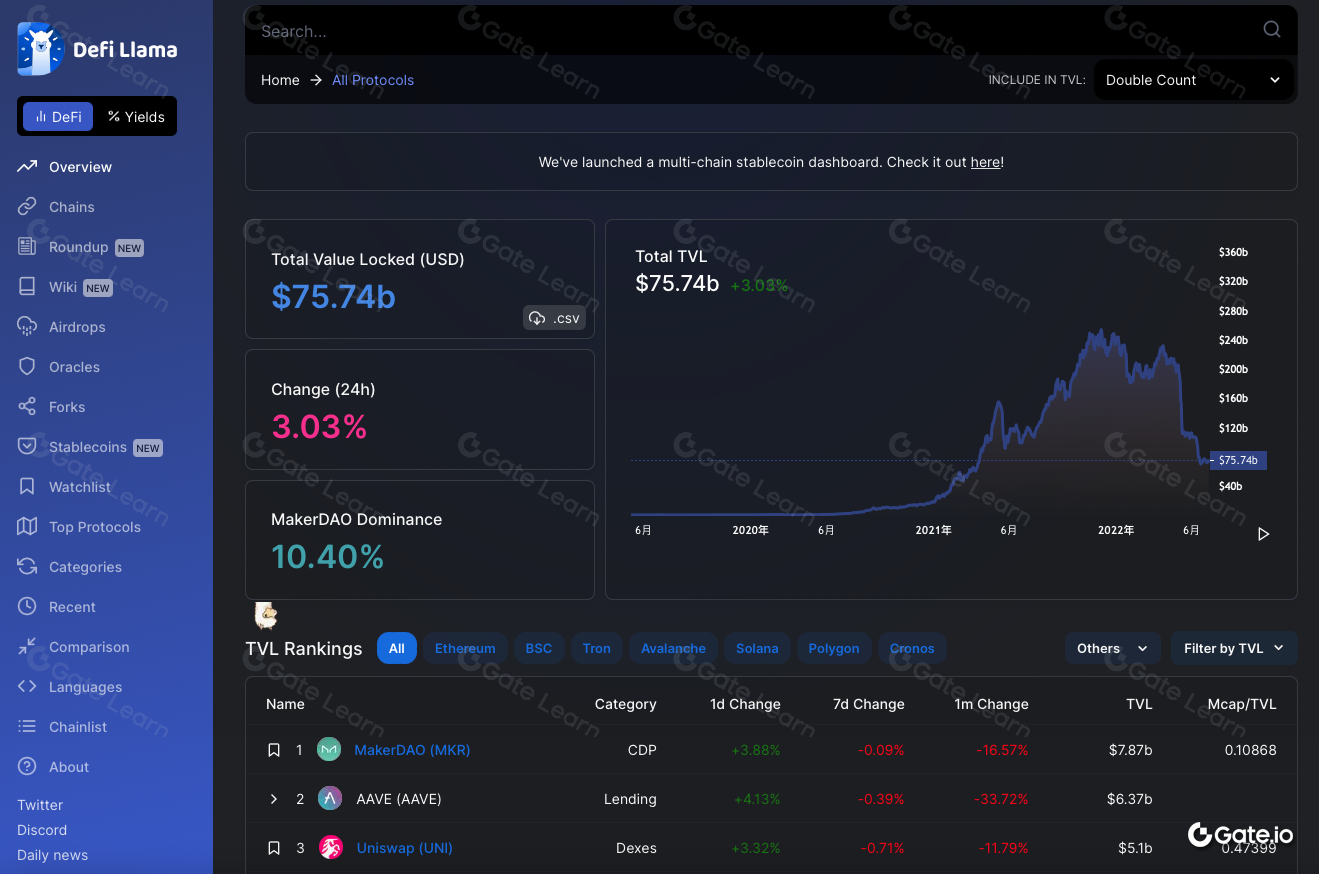
2.ล็อคค่าทั้งหมด (TVL)
TVL หมายถึงสินทรัพย์สภาพคล่องของโปรโตคอล DeFi ซึ่งระบุจำนวนโทเค็นทั้งหมดที่ถูกล็อคอยู่ในกลุ่มทุน ยิ่ง TVL สูง ยิ่งระดมทุนได้มาก ศักยภาพของโครงการก็จะยิ่งมากขึ้นเท่านั้น เราสามารถเข้าใจข้อมูล เช่น การเปลี่ยนแปลงใน TVL และการไหลเข้าและออกล่าสุดของโทเค็นที่ถูกล็อคของโปรโตคอล DeFi บน DeFi Llama
ตัวบ่งชี้ TVL สามตัวที่ใช้กันทั่วไป:
Total Locked Value (TVL): ยิ่ง TVL สูง โปรโตคอล DeFi ก็ยิ่งดี
Market Cap (Mcap) / TVL: ยิ่งอัตราส่วนต่ำ ตลาดยิ่งมีศักยภาพมากขึ้น
ปริมาณการซื้อขาย (VOL) / TVL: ยิ่งอัตราส่วนสูง ผลตอบแทนยิ่งดี
3.โปรโตคอล รายรับ (ความสามารถในการทำกำไร)
รายได้หมายถึงค่าธรรมเนียมทั้งหมดที่ผู้ใช้จ่าย ในขณะที่รายได้ของโปรโตคอลคือส่วนที่จ่ายให้กับผู้ถือโทเค็นของจำนวนเงินทั้งหมดที่ผู้ใช้จ่ายให้กับโปรโตคอล เมื่อคำนวณรายได้โปรโตคอล เราควรพิจารณากลยุทธ์ทางธุรกิจของโครงการต่างๆ เพื่ออธิบายเพิ่มเติม เราจะใช้ NFTs (โทเค็นที่ไม่สามารถทำงานร่วมกันได้) เป็นตัวอย่าง:
เล่นเพื่อรับ: Axie Infinity
Axie Infinity เกมที่ใช้ Ethereum ขับเคลื่อนด้วย Ethereum เป็นเกมเทิร์นเบสบนบล็อกเชนที่เปิดตัวโดยสตูดิโอชาวเวียดนาม Sky Mavis ในปี 2561 ผู้ใช้จะได้รับโทเค็นการกำกับดูแลโดยการต่อสู้กับผู้เล่นอื่นและทำภารกิจให้สำเร็จ เกมนี้ได้รับความนิยมจาก Play-to-Earn (P2E) จากข้อมูลของ CryptoSlam ซึ่งเป็นเว็บไซต์วิเคราะห์ NFT ยอดขายของ Axie Infinity นั้นเกิน 1 พันล้านดอลลาร์ ทำให้เป็นเกมบล็อกเชนที่ใช้ NFT เกมแรกที่มียอดขายเกิน 1 พันล้านดอลลาร์ รายได้จากการขาย NFT ที่สูงของโครงการยังเป็นตลาดหลัก
100% ของรายได้จากโปรโตคอล Axie Infinity จะมอบให้กับผู้ถือโทเค็น ในทางเทคนิค รายได้ของโปรโตคอลและมูลค่าโทเค็นจะเปลี่ยนแปลงในสัดส่วนที่เท่ากัน เมื่อเปรียบเทียบรายได้ของโปรโตคอลหรืออัตราส่วน PE จำเป็นต้องเข้าใจวิธีการทำงานของโครงการ
โมเดล P2E ได้รับความนิยมอย่างล้นหลามในเกมที่ใช้ NFT ซึ่งผู้เล่นสามารถสะสมรางวัล NFT และสามารถถอนทรัพย์สินในโลกแห่งความเป็นจริงได้
ย้ายเพื่อรับรายได้: STEPN
การออกแบบของเกม STEPN ใช้โมเดล dual-token + NFT ของ Axie Infinity มันมีกลไกโทเค็นคู่ ระบบสืบพันธุ์ และระบบพลังงาน รวมถึงโทเค็นเกม GST (โทเค็นสีเขียว Satoshi) โทเค็นการกำกับดูแล GMT (โทเค็น Green Metaverse) และรองเท้าผ้าใบ NFT
STEPN เชื่อมต่อ Web3 กับโลกแห่งความจริงและมอบแพลตฟอร์มให้ผู้ใช้สร้างรายได้ด้วยการวิ่งด้วยรองเท้าเสมือนจริง
ผู้ก่อตั้งทั้งสองได้ร่างต้นแบบและแนวคิดของโครงการในชั่วข้ามคืน ในโมเดลที่ไม่ซ้ำใครนี้ ผู้ถือ NFT รองเท้าผ้าใบเสมือนสามารถรับรางวัลโทเค็นโดยทำภารกิจให้สำเร็จ กว่าหนึ่งเดือนหลังจากการก่อตั้ง STEPN ได้อันดับที่สี่ใน Solana Ignition Hackathon Gaming Track และได้รับเงินสนับสนุน 5 ล้านเหรียญสหรัฐจาก Sequoia ไม่นานหลังจากเปิดตัวในเดือนธันวาคม 2021
ในช่วงต้นเดือนเมษายน STEPN รายงานรายรับ 26 ล้านดอลลาร์ในไตรมาสแรก มีการดาวน์โหลดแอปมากกว่า 1 ล้านครั้งทั่วโลก และมีมูลค่าตลาดประมาณ 1 พันล้านดอลลาร์ และรับประกันการลงทุนจาก Binance จากข้อมูลออนไลน์บน Dune พบว่ารองเท้าผ้าใบ NFT ประมาณ 4,000~5,000 คู่เข้ามาเกือบทุกวันในสัปดาห์ในช่วงปลายเดือนเมษายน
ณ เดือนพฤษภาคม 2565 STEPN มีผู้ใช้งานรายวัน (DAU) 800,000 ราย และผู้ใช้งานรายเดือน (MAU) 3 ล้านราย จากข้อมูลของ TechCrunch หนังสือพิมพ์ออนไลน์ที่เน้นเรื่องเทคโนโลยีขั้นสูงและบริษัทสตาร์ทอัพ รายได้จากแพลตฟอร์มรายวันของ STEPN อยู่ที่ประมาณ 3 ล้านเหรียญสหรัฐถึง 5 ล้านเหรียญสหรัฐ โดยรายได้ต่อเดือนสูงถึง 10 ล้านเหรียญสหรัฐ
ข้อมูลดังกล่าวแสดงรายได้จากโปรโตคอลจำนวนมากของ STEPN ซึ่งมากเกินกว่ารายได้ของบริษัทยูนิคอร์นอื่นๆ ในภาค DeFi, GameFi และแม้แต่ Web3 ในระยะแรก GMT ยังแสดงให้เห็นประสิทธิภาพที่ยอดเยี่ยม โดยเพิ่มขึ้น 40 เท่าภายใน 50 วัน จาก 0.1 ดอลลาร์ในวันที่ 10 มีนาคม เมื่อเปิดตัวครั้งแรกเป็น 4 ดอลลาร์ซึ่งสูงสุดเมื่อวันที่ 30 เมษายน ข้อมูลพื้นฐานของโปรโตคอลนั้นดีและนักลงทุนมีความกระตือรือร้นอย่างมากในตลาดกระทิงนี้ ซึ่งทั้งสองอย่างนี้กำลังเพิ่มระดับราคาโทเค็น เป็นตัวอย่างที่ดีให้เราได้เรียนรู้อย่างแน่นอน อย่างไรก็ตาม จากการที่เฟดประกาศขึ้นอัตราดอกเบี้ย เงินร้อนไหลออก แนวโน้มตลาดเปลี่ยนไป MAU ลดลง และราคา GMT ลดลง
ถ้าดูแค่ปัจจัยพื้นฐานก็เป็นโอกาสในการซื้อที่ดีจริง ๆ แต่จุดขายตัดสินใจยาก นอกเหนือจากการวิเคราะห์ปัจจัยพื้นฐานแล้ว สิ่งสำคัญอย่างยิ่งคือต้องใช้กลยุทธ์การเข้าและออกที่เหมาะสม รวมถึงวินัยในการเทรด
เครื่องมือวิเคราะห์พื้นฐาน
อีเทอร์สแกน
รายละเอียดการทำธุรกรรมสามารถเข้าถึงได้สำหรับทุกคนเพื่อตรวจสอบ blockchains ในบรรดาเบราว์เซอร์บล็อกเชนที่หลากหลาย เรายกตัวอย่าง Etherscan ซึ่งเป็นโปรแกรมสำรวจบล็อกเชน Ethereum ชั้นนำ ซึ่งกระแสเงินทุนของแต่ละธุรกรรมบนเชนนั้นโปร่งใสและตรวจสอบย้อนกลับได้
ใช้โทเค็น SHIBA INU เป็นตัวอย่าง เราสามารถดูได้จากด้านล่างการจัดสรรโทเค็นและที่อยู่กระเป๋าเงินของผู้ถือ รวมถึงการจัดหาโทเค็นทั้งหมดและจำนวนผู้ถือทั้งหมด
โทเค็นเทอร์มินัล
Token Terminal สร้างมาตรฐานข้อมูล cryptocurrency โดยอ้างอิงจากตัวบ่งชี้ตลาดหุ้นทางการเงินแบบดั้งเดิม ช่วยให้นักลงทุนสามารถตรวจสอบมูลค่าของ blockchains และแอพพลิเคชั่นแบบกระจายศูนย์ต่างๆ ได้อย่างง่ายดาย ตัวชี้วัดที่มีอยู่ใน Token Terminal ได้แก่: มูลค่าตลาดรวม, มูลค่าตลาดหมุนเวียน, อัตราส่วนราคาต่อการขาย, อัตราส่วนราคาต่อกำไร, ปริมาณการซื้อขายของโทเค็น, มูลค่ารวมที่ถูกล็อค, ปริมาณสินค้าโภคภัณฑ์ทั้งหมด, รายได้, รายได้โปรโตคอล (ผู้ถือโทเค็น) , ต้นทุนและค่าใช้จ่าย , รายได้รวม ฯลฯ โดยจะให้ข้อมูลโครงการที่เป็นต้นฉบับและดาวน์โหลดได้ ทำให้ทุกคนสามารถทำการวิเคราะห์ข้อมูลได้อย่างรวดเร็วและแม่นยำด้วยความช่วยเหลือของตัวกรองและฟังก์ชันการแสดงผลที่หลากหลาย
ในตัวอย่าง Axie Infinity ที่กล่าวถึงข้างต้น คุณสามารถดูเมตริกต่างๆ ที่มี รวมถึงมูลค่าตลาดรวม มูลค่าตลาดหมุนเวียน อัตราส่วนราคาต่อกำไร และปริมาณการซื้อขายของโทเค็น เพื่อให้ผู้ใช้ทำการวิเคราะห์การแข่งขัน การวิเคราะห์ข้อมูล และเมตริกหลายรายการ การวิเคราะห์โครงการที่คล้ายกัน
ดูนวิเคราะห์
Dune Analytics เป็นเว็บไซต์วิเคราะห์บล็อกเชนที่มีประสิทธิภาพและฟรี ซึ่งคุณสามารถดึงข้อมูลจากบล็อกเชน Ethereum ด้วย SQL (ภาษาโปรแกรมฐานข้อมูล) หรือเพียงแค่คัดลอกโปรแกรม SQL จากผู้อื่นหรือค้นหาโทเค็นโดยตรง ด้วยข้อมูลคุณสามารถสร้างแผนภูมิภาพได้ ทำให้กระบวนการค้นหาข้อมูลง่ายขึ้น ใช้งานง่าย และแสดงผลลัพธ์ที่เห็นภาพมากขึ้น
ในตัวอย่างต่อไปนี้ เราสามารถใช้ Dune เพื่อสืบค้นและวาดแผนภูมิที่แสดงจำนวนผู้ใช้ใหม่ STEPN ที่มีทุกวัน และแผนภูมิแนวโน้มราคาสำหรับช่วงเวลาที่กำหนด เป็นต้น
ข่าวการตลาด
หมายถึงข่าวต่าง ๆ ที่ส่งผลกระทบต่อตลาดในทางลบหรือทางบวก ในตลาดเศรษฐกิจจริง สภาพแวดล้อมโดยรวมจะไม่เพียงส่งผลกระทบต่อตลาดหุ้นเท่านั้น แต่ยังส่งผลต่อสกุลเงินดิจิทัลด้วยเนื่องจากการแลกเปลี่ยนกระแสการเงิน ปัจจัยที่มีอิทธิพลต่อตลาดเศรษฐกิจใน crypto ได้แก่ การอัปเกรดครั้งใหญ่ การจดทะเบียนในตลาดแลกเปลี่ยน ช่องโหว่ของสัญญา ฯลฯ ช่วงเวลาที่สะดุดตาที่สุดใน crypto คือ Bitcoin Halving Cycle สี่ปี การลดลงแต่ละครั้งจะทำให้เกิดช่วงเวลาใหม่ของการกลับตัวจากจุดต่ำสุด ดังนั้นจึงสามารถใช้เป็นข่าวอ้างอิงสำหรับตลาดทั้งหมดได้
[รอบ Bitcoin Halving สี่ปี]
การเปิดตัว Bitcoin: 3 มกราคม 2552 รางวัลบล็อค: 50 BTC
การลดลงครึ่งหนึ่งครั้งแรก: 28 พฤศจิกายน 2555 รางวัลบล็อค: 25 BTC
การลดลงครึ่งหลัง: 9 กรกฎาคม 2559 รางวัลบล็อค: 12.5 BTC
การลดลงครึ่งหนึ่งครั้งที่สาม: 12 พฤษภาคม 2020 รางวัลบล็อค: 6.25 BTC
การลดจำนวนลงครั้งที่สี่: กำหนดในปี 2024 รางวัลบล็อค: 3.125 BTC
โดยการซื้อขายดู
ยอดคงเหลือในการแลกเปลี่ยน
โดยทั่วไปแล้ว การเทขายจำนวนมากมีโอกาสน้อยที่จะเกิดขึ้นในตลาดกระทิง นักลงทุนวาฬส่วนใหญ่ที่ถือครองเงินทุนจำนวนมากจะเก็บสกุลเงินไว้ในกระเป๋าเงินเย็นเพื่อความปลอดภัย ขณะที่อยู่ในตลาดหมี นักลงทุนวาฬอาจขายการถือครองในปริมาณมากเมื่อใดก็ได้เพื่อไม่ให้สูญเสียเงิน ในเวลานี้ หากดุลการแลกเปลี่ยนเพิ่มขึ้น อาจเป็นสัญญาณเตือนถึงการขายออกและอาจทำให้ราคาร่วงลง
ประวัติการทำธุรกรรมของ Whale Wallet
วิธีโดยตรงในการค้นหาธุรกรรมกระเป๋าเงิน Whale คือผ่าน Whale Alert ซึ่งเป็นเว็บไซต์รวบรวมข้อมูลและการวิเคราะห์ ซึ่งคุณสามารถตรวจสอบธุรกรรมกระเป๋าเงิน Whale ของเหรียญต่าง ๆ และค้นหาว่าเหรียญใดอยู่ระหว่างการทำธุรกรรมจำนวนมาก อย่างไรก็ตาม นี่เป็นเพียงสัญญาณในการทำนายแนวโน้มในอนาคตเท่านั้น และไม่ควรใช้เป็นคำแนะนำในการลงทุนโดยตรง
โดย Whale Alert ทวิตเตอร์
ข้อดีและข้อเสียของการวิเคราะห์พื้นฐานของ Cryptocurrency
ข้อดี
ช่วยหาจุดเปลี่ยนเมื่อเทรนด์เปลี่ยน
อำนวยความสะดวกในการรับข้อมูลแบบเรียลไทม์และการเปลี่ยนแปลงของเทรนด์ในทันที
ช่วยระบุเป้าหมายการลงทุนที่เหมาะสม
หลีกเลี่ยงการเทขายอย่างไม่มีเหตุผลซึ่งเกิดจากความตื่นตระหนก
ข้อเสีย
ข้อมูลอาจถูกปลอมแปลง
ไม่มีคำแนะนำและข้อมูลที่เป็นมาตรฐานและครอบคลุมซึ่งเปิดเผยต่อสาธารณะ ทำให้ยากต่อการระบุข้อมูลที่แท้จริง
ข้อมูลบางอย่างที่ทีมงานโครงการให้ไว้อาจถูกซ่อนหรือเป็นเท็จ
การรวบรวมและวิเคราะห์ข้อมูลใช้เวลานานและใช้แรงงานมาก
บทสรุป
เครื่องมือวิเคราะห์พื้นฐานที่ออกแบบมาสำหรับตลาดการเงินแบบดั้งเดิมไม่สามารถใช้ได้กับตลาดเกิดใหม่อีกต่อไป เพื่อตอบสนองต่อสิ่งนี้ เครื่องมือวิเคราะห์เสริมต่างๆ จึงถูกสร้างขึ้น ข้อมูลทั้งหมดจะถูกบันทึกและเผยแพร่สู่สาธารณะบนบล็อกเชนเนื่องจากมีลักษณะเปิด อย่างไรก็ตามการใช้เครื่องมือเสริมเหล่านี้ยังคงอาศัยแอปพลิเคชันต่างๆ ในการรวบรวมข้อมูล
แหล่งข้อมูลของแพลตฟอร์มการวิเคราะห์ทั้งหมดอาจไม่ถูกต้องสมบูรณ์ และข่าวอาจถูกปลอมแปลงได้ง่าย โดยเฉพาะอย่างยิ่งเมื่อนักลงทุน crypto ส่วนใหญ่กระจายอยู่ทั่วโลก ทำให้เป็นจุดบอดด้านกฎระเบียบ แม้ว่าจะมีข้อพิพาทเกิดขึ้น มันเป็นเรื่องยากมากที่จะแก้ไขผ่านการฟ้องร้อง
ปัจจุบัน เราไม่มีโมเดลข้อมูลที่ซับซ้อนและเกณฑ์การประเมินสำหรับการวิเคราะห์พื้นฐานของสกุลเงินดิจิทัลเช่นเดียวกับการเงินแบบดั้งเดิม ยังมีช่องว่างอีกมากสำหรับการปรับปรุงเครื่องมือ อย่างไรก็ตาม หากนักลงทุนสามารถตัดสินใจลงทุนได้อย่างมีประสิทธิภาพโดยมีความเป็นไปได้สูงที่จะได้กำไรจากการสำรวจปัจจัยพื้นฐานของโครงการและใช้รูปแบบการวิเคราะห์และเกณฑ์การประเมินที่ดีกว่า การวิเคราะห์ปัจจัยพื้นฐานยังคงเป็นวิธีที่ดีในการประเมิน
โครงการ Cryptocurrency เพิ่งเฟื่องฟูหลังปี 2020 ตั้งแต่นั้นเป็นต้นมา สถานการณ์การใช้งานที่หลากหลายและสร้างสรรค์ได้เกิดขึ้น อย่างไรก็ตาม ตลาดคริปโตมีความผันผวนอย่างมาก โดยมีความเสี่ยงและโอกาสอยู่ร่วมกัน การออกแบบโมเดลการวิเคราะห์ปัจจัยพื้นฐานที่กำหนดเองจะช่วยให้คุณตัดสินใจลงทุนได้อย่างมีระเบียบวินัยมากขึ้น เนื่องจากคุณสมบัติการลงทุน crypto ที่มีความเสี่ยงสูงและให้ผลตอบแทนสูง รูปแบบการวิเคราะห์ที่ออกแบบมาอย่างดีจะทำให้กลยุทธ์การลงทุนของคุณดีขึ้น
บทความที่เกี่ยวข้อง
Magic Eden คืออะไร: ตลาด NFT ของ Solana
ศึกษาด้วยตัวคุณเอง (DYOR)?