


🔑 註冊帳戶
👨💼 24小時內進行身份認證
🎁 獲得點卡獎勵
加密貨幣新聞、熱點&行業洞察
Today, let's get to know more indicators - RSI
Q: What is RSI?
A: The relative strength index (RSI) is a momentum indicator used in technical analysis that measures the magnitude of recent price changes to evaluate overbought or oversold conditions.
Q: Looks similar to KDJ?
A: RSI is the senior version of KDJ, we can understand it in this simple way.
The biggest difference is RSI measuring the trend of strength will be stronger or weaker, not the accurate price.
KDJ-RSI, similar to MA-MACD. We can use a pair to do analysis.
Q: From Gate.io, there're RSI-S-I(Relative Strength Index) and S-RSI(Stochastic RSI).Which one we should to use?
A: Let's use RSI-S-I(Relative Strength Index) for now.
Q: Alright, let's get to the point - How to read it?
A: Let's check the picture below:
Click RSI-S-I button and the line of RSI appeared in light Purple.
You can see RSI line is almost parallel to KDJ lines, but not exactly the same curve. It is what we mentioned above, RSI line is showing the trend of Stronger or Weakening.
Q: As it is similar to KDJ, how to judge overbought and oversold.
A: Let's see below picture.
RSI is typically along the bottom of a chart and can have a reading from 0 to 100. The midpoint for the line is 50. When RSI moves above 70, the underlying asset is considered to be overbought. Conversely, oversold when the RSI reads below 30.
RSI-S-I increases the sensitivity to relative strength and generates more overbought and oversold signals. However, there may be a significant lag between the signal generated by the indicator and the price chart.
Q: How sensitive is RSI-S-I?
A: Compared with traditional stochastic oscillators, it will trigger more overbought and oversold levels.
Also, there's the areas to recognize the trend.
Divide 100 into four areas, and operate according to the area where the value of RSI falls. The method of dividing the area is shown in the table.
The dividing line between "Extremely strong" and "Strong" and the dividing line between "Extremely weak" and "Weak" are not clear, they are actually a region.
For example, it can also be 30, 70 or 15, 85.
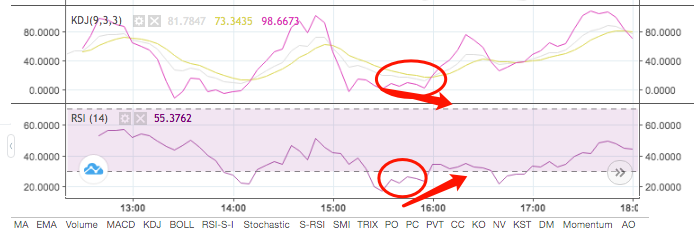
Q: If there's the deviation occurs between RSI-S-I and the price?
A: Sure, we can judge the market from the deviation of RSI and the price.
The RSI is at a high level, and two peaks are formed, one peak is lower than the other peak. At this time, the price corresponds to a peak higher than the other peak, which is a peak deviation, which is a relatively strong sell signal.
The opposite is a bottom divergence: RSI formed two bottoms at a low level, and the price is still declining, which is a signal to buy.
Q: What are Advantage and Disvantage of RSI?
A:
Advantage:
1.Integrates the advantages of RSI and moving average, with clear signals.
2.Calculation basis combines the opening price, highest price, lowest price and closing price, with more comprehensive sampling.
3.High sensitivity.
4.Cooperating with wave theory , MACD, The moving average finds the acceleration starting point and peaks and valleys of the market.
Disadvantage:
1.The parameter cycle setting requires investors to spend time setting according to different market characteristics.
2.Under extreme market conditions, the price change range is inconsistent with the KDJ value.
3.Distortion, commonly known as "passivation", leads to late and early appearances.
4.Sometimes the signal is TOO much sensitive.
Q: Thanks again and let's go to Question Session.
🔑 註冊帳戶
👨💼 24小時內進行身份認證
🎁 獲得點卡獎勵
