


🔑 注册账户
👨💼 24小时内进行身份认证
🎁 获得点卡奖励
加密货币新闻、热点&行业洞察
Today it is time for BOLL.
Q: First question What is BOLL?
A: BOLL, short for Bollinger Bands.
1.In the 1980s, John Bollinger, a long-time technician of the markets, developed the technique of using a moving average with two trading bands above and below it.
2.Bollinger Bands®, such as determining overbought and oversold levels, as a trend following tool, and for monitoring for breakouts.
Key Takeaways:
1.Bollinger Bands® are a trading tool used to determine entry and exit points for a trade.
2.The bands are often used to determine overbought and oversold conditions.
3.Using only the bands to trade is a risky strategy since the indicator focuses on price and volatility, while ignoring a lot of other relevant information.
4.Bollinger Bands® are a rather simple trading tool, and are incredibly popular with both professional and at-home traders.
Q: Can you tell me how to read BOLL band?
A: Bollinger Bands® consist of a centerline and two price channels (bands) above and below it. The centerline is an exponential moving average; the price channels are the standard deviations of the stock being studied. The bands will expand and contract as the price action of an issue becomes volatile (expansion) or becomes bound into a tight trading pattern (contraction).
Q: How to understand BOLL?
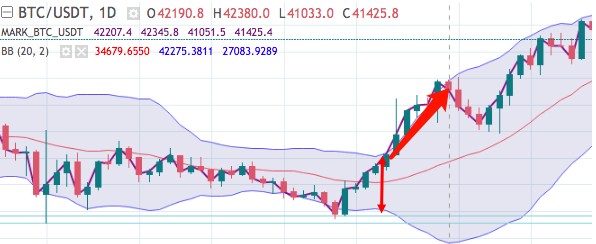
A:When stock prices continually touch the upper Bollinger Band, the prices are thought to be overbought; conversely, when they continually touch the lower band, prices are thought to be oversold, triggering a buy signal.
From the picture above, the bar touched the bottom and top of BOLL band edges.
If the price touches off the lower band, it comes to represent the upper price target in a strong uptrend.
Reversely, if the price touches off the top band, it comes to represent the a strong downtrend.
Q: Usually I read from the media, there are different shapes of BOLL show the different meanings.
A: Yes, you are right, usually we can see 5 shapes.
1.Top band, bottom band central line are paralell horizontally, shows the price is fluctuating between the top and bottom. No big change.
2.Top band, bottom band central line are paralell but upwards, shows the price is uprising.
3.Top band, bottom band central line are paralell but downwards, shows the price is uprising.
4.The squeeze shape occurs when the price has been moving aggressively then starts moving sideways in a tight consolidation. After the squeeze, the price often makes a larger move in either direction, ideally on high volume.
5.Pocket opening, the top band is uprising while bottom band is down dropping, it makes a Pocket Opening, means the price will go upper.
From below picture, there's the squeeze, after this, it created a pocket opening.
Q: Thanks for all of today, and let's get to Question Session.
🔑 注册账户
👨💼 24小时内进行身份认证
🎁 获得点卡奖励
