


🔑 Gate.ioアカウント登録
👨💼 24時間以内にKYC認証を完了
🎁 ポイント特典受取
暗号資産に関するニュースや洞察へのゲートウェイ

A: Please check the following.
1.Candlestick
Red - Bearish
Long solid Bearish, means down trend.
Green - Bullish, means uptrend.
2.Body of candlesticks
1).Long solid body, very firm situation, big down or up.
2).Short solid body, not very firm, a little down or up.
3.Candle wick
1).Top line, means the price was pushed up, the longer the price will go to reverse side deeper.
2).Bottom line, means the price was pushed down, the longer the price will go to reverse side deeper.
3).Which side is longer means the price will go to reverse side.
4.Candlestick + Candle wick
Candle body plus shadow lines will form a lot of different shapes.
Q: How to recognize the open and close of candlesticks?
A:
Candlestick charts are type of price chart that represent the open, close, high and low of a market price over a given period of time and were developed in Japan. Japanese candlesticks are the most popular chart type for trading.
Q: What is a continuation pattern?
A: Please check the following.
A recognisable pattern that can be seen on a price chart that has been shown to indicate a continuation of the current price trend.

Q: Let's study another 5 candlestick continuation patterns.
A: Please check the following.
1.Gaps
Gaps are one of the most widely-used and well known short term trading patterns. .
A bullish gap appears because the open of the second candle is higher than the close of the first candle and the low of the second candle does not reach the close of the first candle. A gap tends to happen at the start of a new trading session due to buyers out numbering sellers while the market was closed. A bearish gap is simply the opposite configuration.
Tasuki gap:
This is a 3-bar pattern where there has been a gap between the first two candles and the third candle partially closes the gap.
The pattern provides a confirmation that the gap has held as well as a better trade entry point.
Gapping play:
This is a pattern that involves one large body candle and two or three small-body candles with the same high in an uptrend or low in a downtrend that are followed by a gap and another long-bodied candle in the same direction as the first.
Side by side white lines:
Similar to the Tasuki gap but the third candle is in the same direction as the first two.
2.Three White Soldiers / Three Black Crows
This pattern is easy to spot with three long-bodied candles in a row, typically also with short wicks. Three White Soldiers is bullish, while Three Black crows is bearish.
3.Rising Three methods / Falling Three methods
This pattern consists of one large body candle followed by three smaller body candles that form in the opposite direction to the first candle. Then a third candle that matches the first candle in size of body and direction.
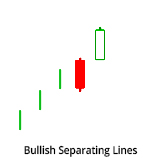
4.Separating lines
This pattern involves a first candlestick that goes against the prevailing trend and then a second candlestick that opens at the same price as the first candlestick. It is like an internal gap pattern.
5.Matching High / Matching Low
This pattern involves two or more matching highs or lows which if broken is a signal that there will be a resumption of the current trend.
Q: Rules to follow with candlesticks.
A:
Rule 1: Candlestick patterns alone do not make a profitable trading strategy.
Buy signals and sell signals from a random formation of one to three candlesticks alone will generate a lot of false signals.
Rule 2: Part of what makes a candlestick pattern valid is whether the pattern takes place on a chart.
A Trend reversal candlestick is only valid at the end of an established trend. Continuation patterns are only valid after a trend has started.
Rule 3: Candlestick patterns need to be used in conjunction with other analysis.
Their best use tends to be as a "confirmation signal" at a price level determined to be a good entry point by other forms of technical analysis.
🔑 Gate.ioアカウント登録
👨💼 24時間以内にKYC認証を完了
🎁 ポイント特典受取
