


🔑 Gate.io hesabı açın
👨💼 24 saat içinde KYC (Müşterini Tanı) işlemlerini tamamlayın
🎁 Puan Ödüllerini Alın
Kripto haberlerine ve içgörülerine Açılan Kapınız
Q: In this event we will talk about the 5th tool of Fibonacci - Time Zone.
A: Let's go through the basic knowledge first. Here to review of some basic points of Fibonacci.
1.Fibonacci levels are used as guides, possible areas where a trade could develop. The price should confirm prior to acting on the Fibonacci level.
2.The usage of the Fibonacci studies is subjective since the trader must use highs and lows of their choice. Which highs and lows are chosen will affect the results a trader gets.
3.Only measure single way trend.
Q: Let's talk about the time frame to be used for Fibnacci.
A:
1.They are very popular with financial market technical analysis traders because they can be applied to any time frame.
2.If you used it for a long term time frame of 1M/1W/1D, maybe you will get entries once or twice a week, but it is more stable and safe.
3.If you use it for a short term time frame of 8H/4H/1H/30M, the you will get many entries but you will take more risks.
Q: And let's study the meaning of Fib Time Zone.
1.Fibonacci time zones are vertical lines that represent potential areas where a swing high, low, or reversal could occur.
2.Fibonacci time zones may not indicate exact reversal points. They are time-based areas to be aware of.
3.Fibonacci time zones only indicate potential areas of importance related to time.
Q: Now let's go to the details about how Fibonacci Time Zones Work.
A:
1.Fibonacci times zones are these numbers when added to the initial time selected. Thus, if we choose a start date of April 1, this would be the time (0). The first Fibonacci time zone vertical line will then appear on the next trading session (1), the second will appear two sessions later (2), and then three (3), five (5), and eight (8) days later, and so on.
2.If adding Fibonacci time zones by hand, the first five numbers can be avoided, as the indicator is not particularly reliable when all the vertical lines are packed together. Therefore, some traders start drawing their vertical lines 13 or 21 periods after their starting point.
Q:What Do Fibonacci Time Zones Tell You?
A:
1.Fibonacci time zones can be used for confirmation of trades or analysis. For example, if the price is approaching a support area and also a Fibonacci time zone, and the price then rises off support, the two methods confirm each other.
2.A low point is potentially in and the price could keep rising. Another form of analysis is required for assessing how high the price may rise, as Fibonacci time zones don't indicate the magnitude of moves. The price may make a low and then rise significantly, or it may only temporarily rise before falling to a new low.
Q: Let's see how Fibonacci Time Zones vs. Fibonacci Retracements
A:
1.Fibonacci time zones are vertical lines that represent future time periods where the price could make a high, low, or reverse course.
2.Fibonacci retracements instead indicate areas the price could pull back off of a high or low. Retracements are price-based and provide support or resistance areas based on Fibonacci numbers.
Q: And let's see what is the Limitation of Using Fibonacci Time Zones.
A:
1.Fibonacci time zones are a subjective indicator in that the starting point selected will vary by trader.
2.Time zones don't provide any information on the magnitude of price moves.
3.The indicator shouldn't be used on its own. Combine it with trend and price action analysis, as well as other technical indicators and/or fundamental analysis.
4.The first few Fibonacci numbers create relatively tight Fibonacci Time Zones at the beginning of the chart. Because of this it may be necessary to ignore the first few zones. After the first few zones, the zones expand quickly and allows some breathing room as the sequence unfolds.
Q: Let's take a look at how to use Fib Time Zone.
A:
Please go to the link below to study basic drawing skills.
https://www.youtube.com/watch?v=6aIM2a8jJHY
Fib Time Zone
1.Go to Trading View, select trade pair.
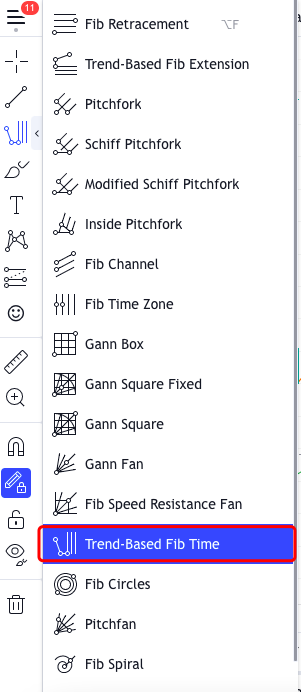
2.Select Trend-Based Fib Time tool from the left tool kit.
3.Find the trend and draw from low to high or high to low.
1) From Youtube, he smartly drew a basic trend line to show out the current trend. It is a good way to help you to analyze the basic trend.
2) And then you can set up the start point from the low to high.
3) Obviously, the bullish candlestick touched 0.618 on Setp.30th and up until Oct 11th. The ratio of Oct. 12th is 1.382, this ratio is not very popular as it is not golden ratio.
4) Golden ratio 1.618 is at the line of Oct.15th.
5) From the pattern below, after a long bullish candlestick, there's the possibility that it may start to go down.
6) So there are two possibilities will occur:
The pull back at 1.681 of Oct. 15th
The break through at 1.681 of Oct. 15th.
Conclusion:
1.Remember to combine other tools to analyze the possibilities.
2.At this moment, you can use Retracement to analyze the pull back, as now it is the signal of changing.
3.Check below Fib Retracement result.
Q: Hope you learned something new. Let's go to Question Session.
🔑 Gate.io hesabı açın
👨💼 24 saat içinde KYC (Müşterini Tanı) işlemlerini tamamlayın
🎁 Puan Ödüllerini Alın
