


🔑 注册账户
👨💼 24小时内进行身份认证
🎁 获得点卡奖励
加密货币新闻、热点&行业洞察

Classic divergences are price reversal patterns while hidden divergences are trend continuation patterns.
MACD, RSI and stochastic oscillators are the indicators you use with price action to identify divergences.
Traders can use divergence to identify trade entry and exit points.
One drawback of hidden divergences is that they are difficult to spot.
At times, divergences may indicate weak trend reversals
Traders who use the MACD, EMA, RSI and Stochastic Oscillator often use crossovers and divergences to analyze price movements of cryptocurrencies. Importantly, these technical indicators are present on many trading platforms such as Gate.io. This guide covers how traders use divergences as part of their trading strategies. We will cover classic and hidden divergences.
What is divergence?
Divergence is a technical pattern where the price of the asset moves in an opposite direction to the trading indicator. In other words, there is no positive relationship between the price and the value of a technical indicator. For example, this happens when the price of the asset is increasing while the value of a technical indicator is falling.
In most cases, divergences show possibilities of price reversals. Usually, there are two types of divergence, a bullish divergence and a bearish one. Also, we have classic divergence and hidden divergence.
Classic or regular divergence
A regular or classic divergence occurs when the price makes higher highs while the indicator records lower highs. Alternatively, a regular divergence occurs when the price makes lower lows while the indicator makes higher lows. Classic divergences occur during trending markets namely uptrend or downtrend.
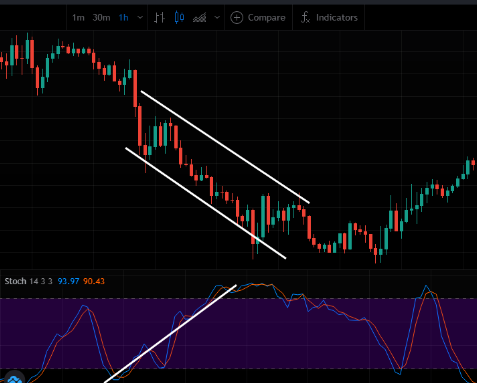
Example of divergence- Vfxalert
In the above image, the price is falling while the indicator is rising.
As said, for a convergence to occur there should be a technical indicator. Some of these technical indicators include the Relative Strength Index (RSI), the stochastic oscillator, moving average convergence divergence (MACD). As you note, these are all momentum indicators.
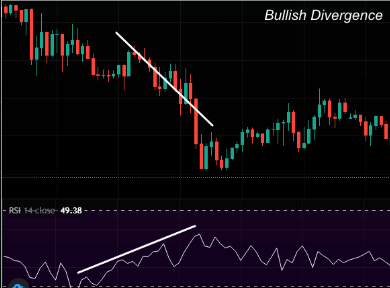
A bullish divergence takes place when the price is making lower lows while the indicator is showing higher lows.
Classic bullish divergence – Vfxalert
As observed, the price is falling while the indicator is rising. This takes place at the end of a downtrend and it indicates a high possibility of an upward price reversal.
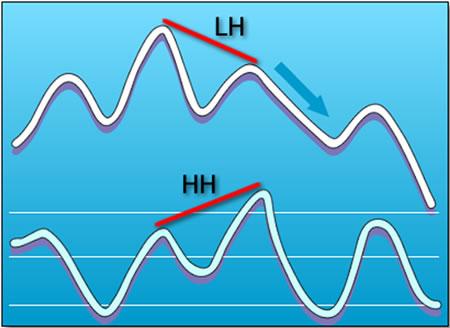
The bearish divergence occurs when the price is making higher highs while the indicator is registering higher lows. As you anticipate, the bearish divergence occurs in an uptrend and it indicates a potential downward price reversal.
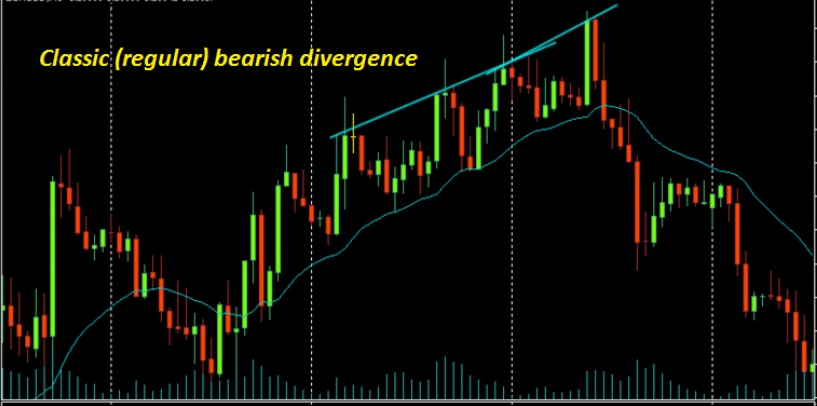
Classic bearish divergence- Fcxchiefs
As the above diagram denotes, the price is rising while the indicator is falling.
Hidden divergence
There is hidden divergence if the price is making higher highs or lower lows while the indicator is recording lower highs or higher lows, respectively. Unlike classic divergences which show price reversals, hidden divergences are continuation patterns. They indicate the end of consolidations that exist within larger trends.
They are called hidden divergences because traders who are not well-versed with them find it difficult to spot them. We also have a bearish hidden divergence and a bullish one. A hidden bullish divergence occurs when the price makes a higher low while the indicator records a lower low.
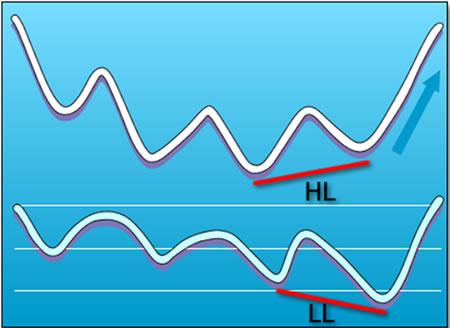
Hidden bullish divergence- Babypips
The price line, the top one, shows a higher low while the trading indicator shows lower lows.
The hidden bearish divergence takes place when the price records a lower high while the indicator shows a higher high.
Hidden bearish divergence- Babypips
How to use divergences
Basically, divergences help traders to change their trading strategies. For example, if traders identify classic bullish divergences they can enter long positions or exit short ones.
On the other hand, if traders spot classic bearish divergences they can exit their long positions or short the market.
Since the hidden bullish divergence occurs during a correction in an uptrend, the traders can close their long positions and take profit. If a hidden bearish divergence emerges, the traders should close their positions as well.
Traders can also use the hidden divergence to place stop losses. When you spot a hidden divergence, place a stop loss before the recent highest swing as indicated in the next diagram.
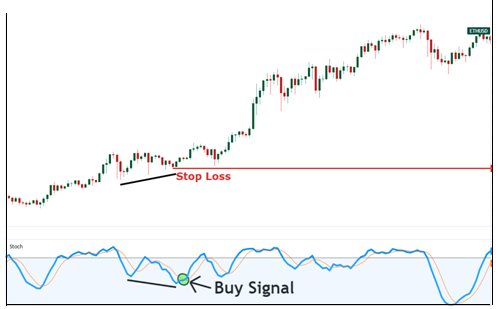
Using hidden divergence to place stop losses- Learnbybit
Traders can use momentum indicators such as MACD to identify the general market trend, and then use divergences as confirmation to enter or exit their positions. For example, when using a 20 period simple moving average (SMA) if a classic bullish divergence appears when the price is above 20 SMA, a trader can open a long position.
Difference between classic divergence and hidden divergence
The main difference between the two is that classic divergences indicate price reversals while hidden divergences are continuation signs.
How to use Divergence at Gate.io
You can use divergences at most trading platforms such as Gate.io.This is because there are different momentum indicators like MACD, RSI and stochastic oscillator. What you need to do is to add any of these indicators on your trading chart. The list of indicators is shown above the chart.
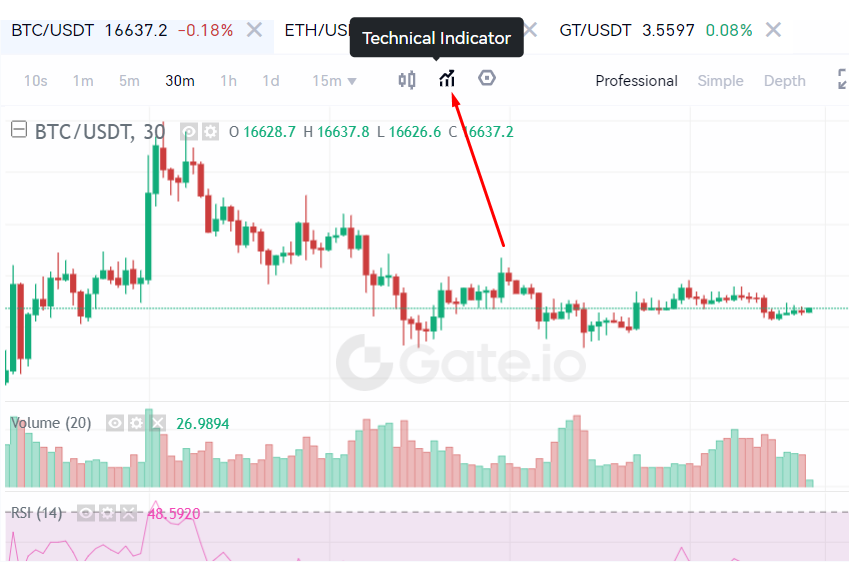
Adding technical indicators on the chart- Gate.io
Once you click “Technical Indicators'', you find the list of indicators. To add it to the chart, click it. Once it appears, you constantly check for the divergences.
Limitations of divergence
First, a trader should not use divergences alone. Instead, they should use them with other indicators and price action. Also, inexperienced traders should focus on classic divergences before using hidden ones.
Secondly, classic divergences do not always indicate strong price reversals. Sadly, some of the reversals may not be strong.
The divergences are more accurate with longer time frames such as 1 week or month. However, traders who rely on long time frames tend to have few trades.
Conclusion
Many traders use divergences when trading cryptocurrencies as they help to identify entry and exit points. The main momentum indicators they use are MACD, RSI and stochastic oscillators. Classic divergences can indicate possible trend reversals while hidden divergences are continuation signals. The classic divergence is an essential tool for new traders as it is easy to use.
Author: Mashell C., Gate.io Researcher
This article represents only the views of the researcher and does not constitute any investment suggestions.
Gate.io reserves all rights to this article. Reposting of the article will be permitted provided Gate.io is referenced. In all cases, legal action will be taken due to copyright infringement.
🔑 注册账户
👨💼 24小时内进行身份认证
🎁 获得点卡奖励
