The Technical Pattern of Bottom Fishing– Double Bottoms (W Bottom)

I. What is Double Bottoms pattern?
II. Technicals of the Double Bottoms
III. Application of the Double Bottom pattern
IV. Double Bottoms formation failures
Summary
Disclaimer:
I. What is Double Bottoms pattern?
When the price falls to a certain price level, the trading volume shrinks, showing that no traders are willing to continue selling, so they would place the stop loss. Then the price rebounds under the impetus of buying, and the trading volume increases accordingly.
However, the rise soon met with selling pressure and the price fell for a second time. The price stopped again when it fell to a level almost equal to the previous low, while trading volume shrank and was lower than on the previous drop.
At this point the price rise again, and trading volume was also significantly larger than the first time. This rise managed to surpass the previous highs marks the formation of a Double Bottoms pattern.
Graphically, this technical pattern has two troughs (lowest points), hence the name Double Bottoms. It is also called a W-bottom because this pattern resembles the the shape of the alphabet “W” as shown in Figure 8-1.
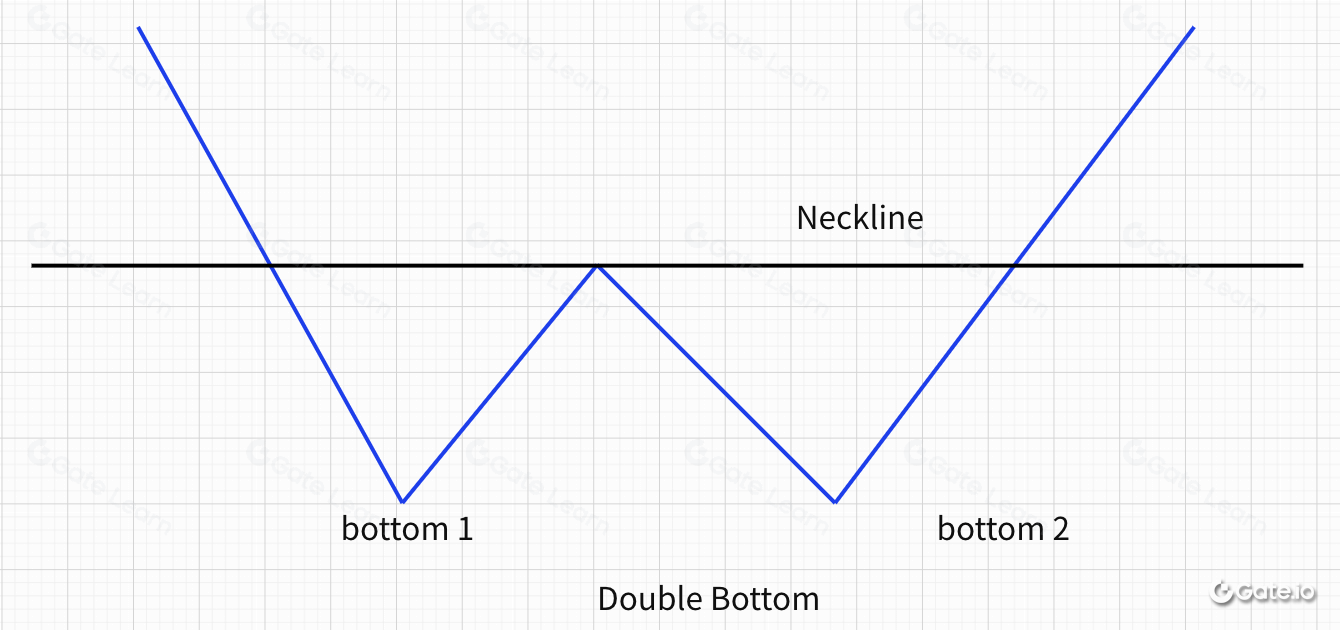
The horizontal line drawn across the peak point is the Neckline of the Double Bottom. The Neckline is an important dividing line for traders to choose go long or short in the Double Bottom pattern.
II. Technicals of the Double Bottoms
It appears at the end of a downtrend or medium-term adjustment trend.
the two troughs are at the same level, or the right one is slightly higher.
In most Double Bottom pattern, trading volume at the right trough is smaller than the left, while in the second rise, the trading volume will generally be greater than the first rebound.
The Neckline of a Double Bottom is usually the horizontal line passing the first rebound high. Sometimes it will be slightly inclined due to the pattern.
III. Application of the Double Bottom pattern
A double bottom is a technical analysis charting pattern of price reversal, indicating that the price has bottomed out and is a buy signal. The specific application is divided into the following cases.
- Example of real trading

The above chart is a daily chart of SOL/USDT. Between 2020-9-1 and 2020-11-4, SOL fell from a high of 4.5u to a low of 1.28u, a cumulative drop of 72.8%, and then started a strong rally to 2.4u. When it went bottom fishing and took profits, the price fell again to about 1.2u, forming a double bottom from the whole pattern. After that, a wave of bullish market was opened.
- Double Bottoms Entry Point 1: when the Double Bottom is about to form, step back again to form a second low point. Then the prices rebound and the price break through the Neckline to close the positive line, which is now the entry point 1. This indicates a greater probability that the market will continue to rise as shown in the following chart:

- Double Bottoms Entry Point 2: when the price breaks through the Neckline and rebound to the peaks and blocked, it retreats to the Neckline level and retrace to confirm support. At this point, which is Entry Point 2 as shown in the following chart:
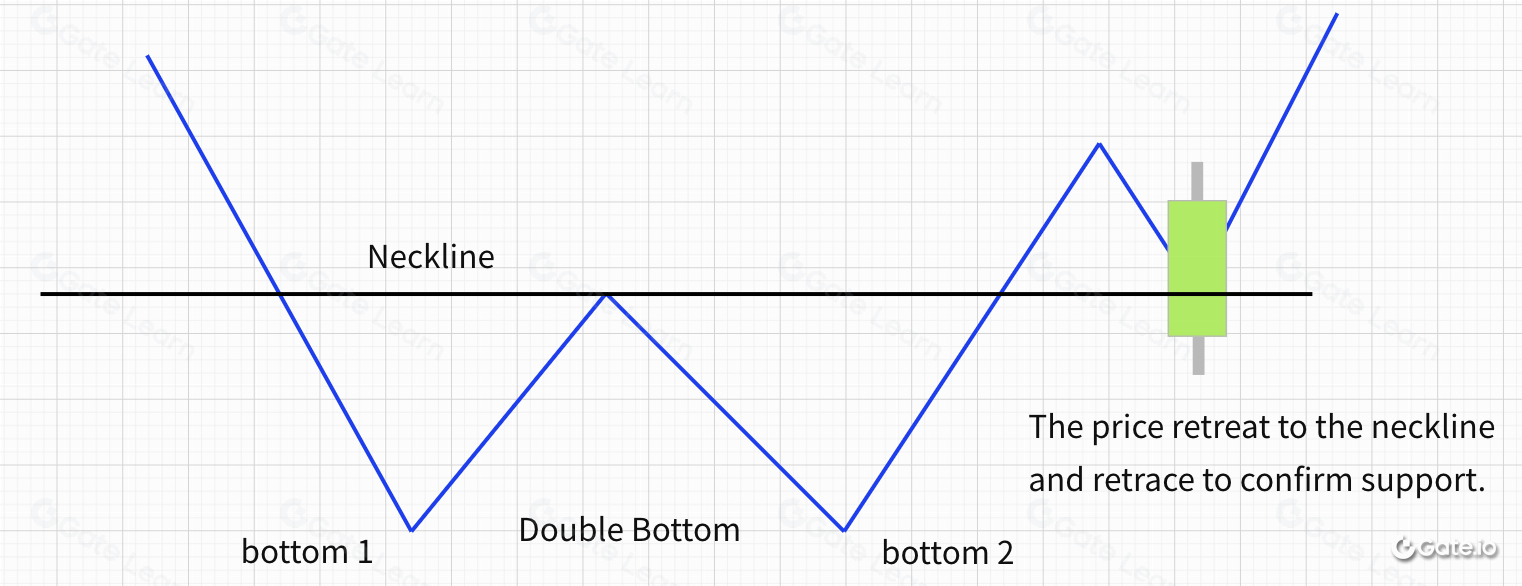
- Double Bottoms Entry Point 3: When the price rises again after retrace to the Neckline and breaks through the previous price high, the rising K-line entity through the previous high resistance level, it serves as the Entry Point 3 as shown in the following chart:
Finally, let’s summarize the Double Bottoms application techniques. First, draw a Neckline through the rebound high, and then confirm the three entry points based on whether the rising K-line closes positive.
a. Break the Neckline, Entry Point 1.
b. Rebound to confirm the Neckline, Entry Point 2.
c. Break through the previous rebound high, Entry Point 3.
IV. Double Bottoms formation failures
Even if the formation of the Double Bottom, there is no guarantee that the subsequent rise is foolproof. Once the price retrace to the Neckline support and form the following falling K line with the entity fell through the Neckline, it indicates a bearish market and signifies traders to go short, the market is likely to form the downward trend as seen in the following chart:

Summary
Dow Theory is the theoretical basis of technical analysis. if you have a solid theory foundation, it will be easy for you to learn the technical analysis. The Double Bottoms is also a typical application of Dow Theory in terms of trend operation.
For more information on futures trading, please visit the Gate.io futures platform and click to register and start your futures trading journey.

Disclaimer:
This is being provided for reference purposes only. The information provided by Gate.io above does not constitute investment advice and bears no responsibility for any investment you may make. The information regarding technical analysis, market judgments, trading tips, and trader sharing may involve potential risks, investment variables, and uncertainties, and this issue does not provide or imply any opportunity for guaranteed returns.
相關文章

Understanding The Moving Average

What is trend trading?
