

Render
RNDR
$9.13
Render (RNDR) Price Trends
Time period | Change amount | % Change |
|---|---|---|
1H | $+0.03000 | +0.37% |
24H | $-0.1700 | -1.82% |
7D | $+1.1 | +13.64% |
30D | $-1.43 | -13.58% |
1Y | $+7.38 | +423.44% |
Credibility Indicators
79.75
Reliability Score
Rank #1
# 705
Percentile
TOP 5%
Team Members
Jules Urbach
CEO,Founder
Charlie Wallace
CTO
Trevor Harries-Jones
COO
Ariel Emanuel
Advisor
Investors
Multicoin Capital
Solana Ventures
Kenetic Capital
Sfermion
Vinny Lingham
Bill Lee
Alameda Research
Live Render (RNDR) Price Update
Render price today is $9.13 with a 24-hour trading volume of $158.7 M, and as such Render has a market cap of $3.49 B, giving it a market dominance of 0.17%. The Render price moved -1.82% in the last 24 hours.
Render reached its highest price on 2024-03-17 when it was trading at its all-time high of $13.53, while its lowest price was recorded on 2020-06-16 when it was trading at its all-time low of $0.03666. The current lowest price since the last cycle high was $0.03666, and the highest price since the last cycle low was $13.53. The social sentiment of Render is currently Positive.
The current circulating supply of Render is $381.86 M RNDR. In terms of market cap, Render is currently ranked 46.
About Render (RNDR)
FAQs
1. What determines the price movement of Render?
There are two schools of thought in determining the price of Render.
By way of intrinsic value: This typically involves on-chain metrics, project metrics and financial metrics of Render, collectively known as fundamental analysis. The law of supply and demand, tokenomics, use case, project roadmap as well as regulations and governance involved would affect the value of Render from a long term perspective.
By way of price action: Primarily analyzed via candlestick chart patterns and technical indicators such as MACD, RSI and the bollinger bands, technical analysis forecasts the price of Render on the basis that history tends to repeat itself. As the candlestick charts are a general representation of the emotion of the market, news announcements and community sentiment can be significant price action drivers for Render as well.
Investors tend to prefer the long term nature of fundamental analysis, whereas short term traders tend to rely on technical analysis more. In reality, both analyses may combine and create interesting scenarios for Render and the cryptocurrency market as a whole.
2. What is the highest price of Render price in history?
3. What is the lowest price of Render price in history?
4. What is the current market cap of Render?
5. How many Renders are there in the market?
6. What is the maximum supply of Render?
7. What is the fully diluted market cap (or FDV) of Render?
8. What is the price prediction of Render in the near future?
9. Is Render a good investment?
10. How to buy Render?
Render Tokenomics
Next Unlock Events
Next Unlock Events
RNDR --
(--% Total Supply)
$--
(--% Market Cap)
Unlock Rounds --
--
D
--
Unlock Rounds --
--
D
--
RNDR --
(--% Total Supply)
$--
(--% Market Cap)
Vesting Info
Links to official documents
Allocations
Name | Total | Unlocked | Locked |
|---|---|---|---|
Render User Development Fund | 55% | -- | -- |
Token Sale | 25% | 25% | -- |
Team | 10% | 10% | -- |
Reserve | 10% | -- | -- |
Vesting Info
Links to official documents
Vesting Schedule
Render Analysis
Render (RNDR) News

Bitcoin price surge toward $40K boosts sentiment in KAS, RUNE, MNT and RNDR
Bitcoin’s recent rally toward $40,000 could further fuel traders' bullish sentiment for KAS, RUNE, MNT and RNDR.

Protocol Village: Render Moving to Solana From Ethereum, Allocates $2.6M to Cover Fees
The latest in blockchain tech upgrades, funding announcements and deals. For the period of Nov. 2-8, with live updates throughout.

Bitcoin price holds $26K as MKR, AAVE, RUNE and RNDR flash bullish signals
Bitcoin looks ready to start a relief rally and this could trigger interest in MKR, AAVE, RUNE and RNDR.

Grayscale’s SEC Victory May Render Alameda’s Redemptions Lawsuit Unnecessary, Bloomberg Analysts Say
The ruling could lead to Grayscale's GBTC converting into a bitcoin ETF, which would allow redemptions, making Alameda's suit unnecessary, Bloomberg Intelligence analysts said in a note on Wednesday.
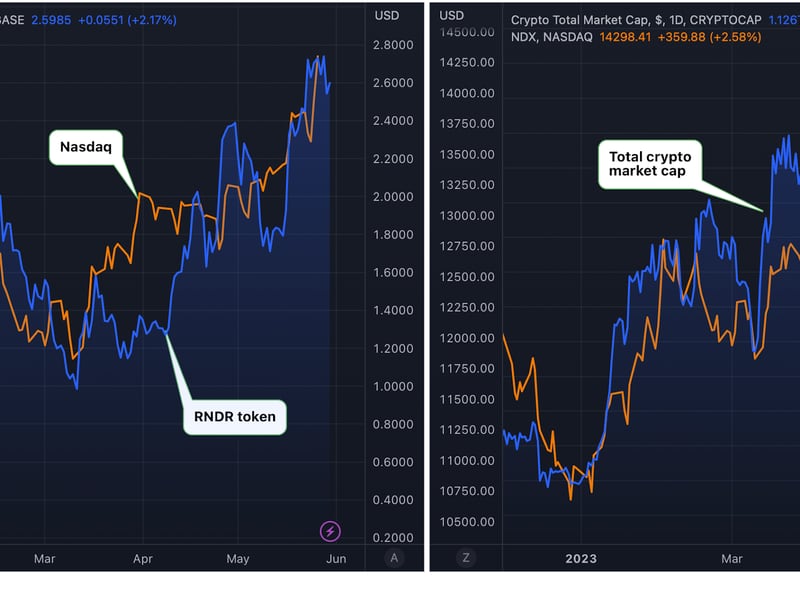
Blockchain-Based Render Network's Token Tracks Tech Stocks as Broader Crypto Market Decouples
RNDR has been a good high beta Nasdaq play in recent weeks, one portfolio manager noted.

Blockchain-Based Render Network Token Rising After Community Vote for New Burn-and-Mint Model
The utility token of Render Network has jumped 80% over the past seven days following the passage of a new tokenomics model proposal on the network.
Date | Market Cap | Volume | Open | Close |
|---|---|---|---|---|
2024-04-23 | $3.59 B | 20.67 M RNDR | $9.33 | N/A |
2024-04-22 | $3.49 B | 17.56 M RNDR | $9.09 | $9.33 |
2024-04-21 | $3.47 B | 20.25 M RNDR | $9.03 | $9.09 |
2024-04-20 | $3.04 B | 27.36 M RNDR | $7.91 | $9.03 |
2024-04-19 | $3.16 B | 31.44 M RNDR | $8.23 | $7.91 |
2024-04-18 | $2.94 B | 22 M RNDR | $7.66 | $8.23 |
2024-04-17 | $3.18 B | 32.48 M RNDR | $8.27 | $7.66 |
2024-04-16 | $3.17 B | 36.77 M RNDR | $8.29 | $8.27 |