

Cash Driver
CD
$0.001553
Cash Driver (CD) Price Trends
Time period | Change amount | % Change |
|---|---|---|
1H | $-- | -- |
24H | $-- | -- |
7D | $-- | -- |
30D | $-0.01000 | -86.88% |
1Y | $-- | -- |
Credibility Indicators
47.64
Reliability Score
Rank #1
# 7835
Percentile
BTM 65%
Live Cash Driver (CD) Price Update
Cash Driver price today is $0.001553 with a 24-hour trading volume of $4.72 M, and as such Cash Driver has a market cap of $--, giving it a market dominance of 0.0012%. The Cash Driver price moved 0.00% in the last 24 hours.
Cash Driver reached its highest price on 2022-11-26 when it was trading at its all-time high of $0.004677, while its lowest price was recorded on 2022-11-27 when it was trading at its all-time low of $0.000001000. The current lowest price since the last cycle high was $0.000001000, and the highest price since the last cycle low was $0.004677. The social sentiment of Cash Driver is currently Positive.
The current circulating supply of Cash Driver is $-- CD. In terms of market cap, Cash Driver is currently ranked 7175.
About Cash Driver (CD)
FAQs
1. What determines the price movement of Cash Driver?
There are two schools of thought in determining the price of Cash Driver.
By way of intrinsic value: This typically involves on-chain metrics, project metrics and financial metrics of Cash Driver, collectively known as fundamental analysis. The law of supply and demand, tokenomics, use case, project roadmap as well as regulations and governance involved would affect the value of Cash Driver from a long term perspective.
By way of price action: Primarily analyzed via candlestick chart patterns and technical indicators such as MACD, RSI and the bollinger bands, technical analysis forecasts the price of Cash Driver on the basis that history tends to repeat itself. As the candlestick charts are a general representation of the emotion of the market, news announcements and community sentiment can be significant price action drivers for Cash Driver as well.
Investors tend to prefer the long term nature of fundamental analysis, whereas short term traders tend to rely on technical analysis more. In reality, both analyses may combine and create interesting scenarios for Cash Driver and the cryptocurrency market as a whole.
2. What is the highest price of Cash Driver price in history?
3. What is the lowest price of Cash Driver price in history?
4. What is the current market cap of Cash Driver?
5. How many Cash Drivers are there in the market?
6. What is the maximum supply of Cash Driver?
7. What is the fully diluted market cap (or FDV) of Cash Driver?
8. What is the price prediction of Cash Driver in the near future?
9. Is Cash Driver a good investment?
10. How to buy Cash Driver?
Cash Driver Tokenomics
Next Unlock Events
Next Unlock Events
CD --
(--% Total Supply)
$--
(--% Market Cap)
Unlock Rounds --
--
D
--
Unlock Rounds --
--
D
--
CD --
(--% Total Supply)
$--
(--% Market Cap)
Allocations
Name | Total | Unlocked | Locked |
|---|---|---|---|
No record | |||
Vesting Schedule
Cash Driver Analysis
Cash Driver (CD) News

Gate.io AMA with AsMatch-The First Social Layer on Manta Network Powered by Polygon CDK and Celestia DA
Gate.io hosted an AMA (Ask-Me-Anything) session with Ritty,Co-founder of AsMatch in the Twitter Space.

From CCDAS to ZEBU LIVE: Gate Web3's Journey in Shaping the Web3 Landscape
Leading blockchain and cryptocurrency player, Gate Web3, proudly recaps its exceptional participation in two recent events: the CCDAS _Crypto and Blockchain Data Analytics Summit_ and its exclusive after-party from 2 to 3 October 2023.
MACD, The Most used Trading and Technical Analysis Indicator
Why Many Traders Use the MACD Indicator?

Daily Flash | Number of Bitcoin Holders Has Been Rising Despite Bear Market, McDonald‘s Begins To Accept Bitcoin and Tether In Swiss Town
_ious analysts have begun to speculate that October could be a pivotal time for Bitcoin, with previous years having indicated that Bitcoin typically inflates in value by 24% across October.
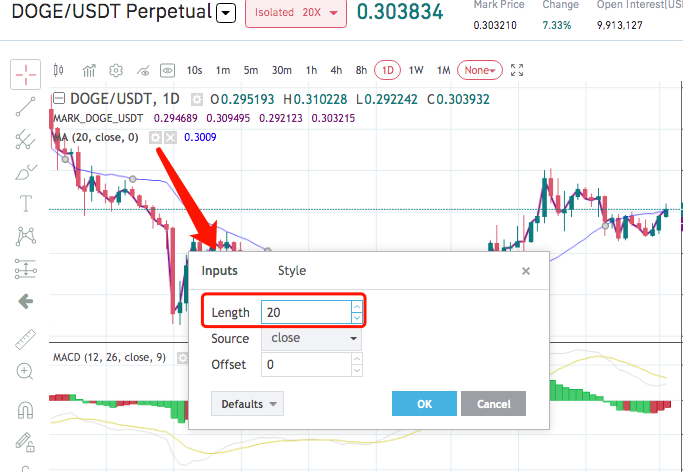
Gate.io AMA - Livestream, indicators review and analysis | MA, MACD, BOLL | Oct.7th
Firstly, let's review the basic knowledge of MA, MACD and BOLL. MA 1.A Moving Average (MA) is a calculation that takes the arithmetic mean of a given set of prices over the specific number of days in the past; in GATE.IO, we can change the days. 2.Click setting and the below box...
Gate. io AMA : Indicator - MACD
Q: What is MACD? A: We have presented AMA of MA, the difference between MA and MACD is: 1.MA, is showing the price position according to the calculation of the period data. 2.MACD, is showing the trend is strengthening or weakening. Q: What is the definition of MACD?...
Date | Market Cap | Volume | Open | Close |
|---|---|---|---|---|
No record | ||||