


🔑 Register an account with Gate.io
👨💼 Complete KYC within 24 hours
🎁 Claim Points Rewards
Your Gateway to crypto news and insights
Q: What is K-Line Pattern?
A: We presented Candlesticks in the previous AMA event, basically K-line patterns is the essence of candlestick Technical Analysis.
Q: Can you please tell us more about Technical Analysis?
A: Technical analysts have long used price patterns to examine current movements and forecast future market movements.
Key points:
Patterns are the distinctive formations created by the movements of the prices on a chart and are the foundation of technical analysis.
A pattern is identified by a line that connects common price points, such as closing prices or highs or lows, during a specific period of time.
Technical analysts seek to identify patterns as a way to anticipate the future direction of the price.
Q:How to do the analysis from the patterns?
A:Basically, you need to draw the lines and analyze the trend from the drawing.
Q:Sounds interesting, I can pick up my drawing skills from the art course in the university!
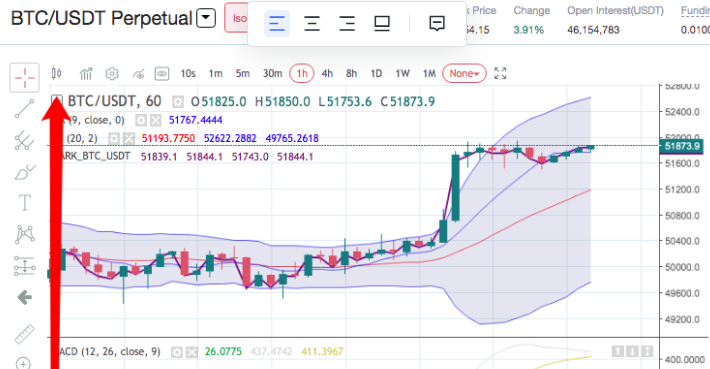
A:Haha, yes, and there's the tools kit beside the pattern to help you. You can see below picture and let's get to the details step by step.
Q: Yap, I can see there's the tool kit.I think it is easy to practice. How to read the trend is more important.
A: Yes, today let's list out some pattern types for basic understanding.
Firstly let's understand the basic definitions of Trendlines.
We call the drawing line as Trendlines.
Trendlines are straight lines drawn on a chart by connecting a series of descending peaks (highs) or ascending troughs (lows).
The up trendline is drawn by connecting the ascending points. Conversely, a trendline that is angled down, called a down trendline.
Trendlines will vary in appearance depending on what part of the price bar is used to "connect the dots."
Trendlines often use closing prices, rather than highs or lows.
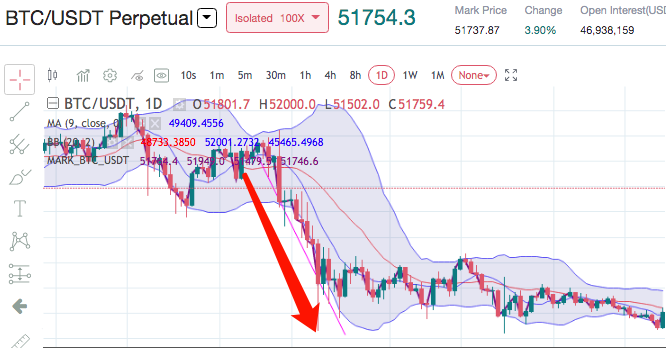
From below Arrowed pink trendline, you can see the price is going down.
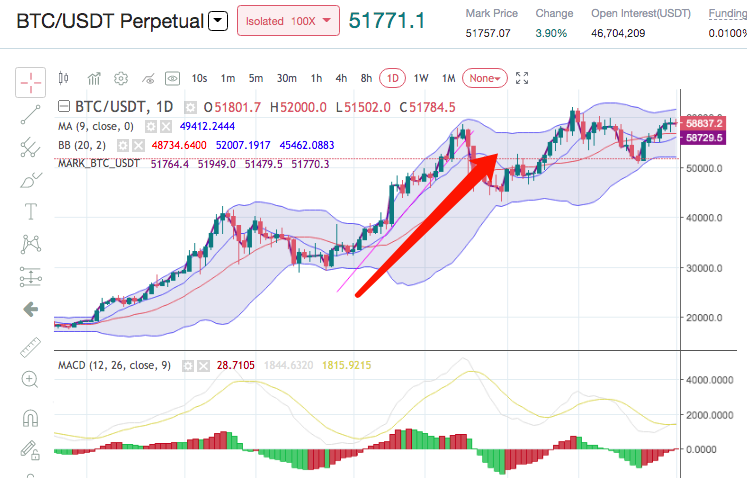
Conversely, from below picture, you can see Arrowed pink trendline, the price is rising.
Q: Seems drawing is not that difficult.
A: Above straight line is very simple and basic line. There are more different types as below:
Today we mainly focus on K-Line patterns can show the uptrend.
Cup and handle is a bullish continuation pattern where an upward trend has paused, but will continue when the pattern is confirmed.
The "handle" forms on the right side of the cup in the form of a short pullback that resembles a flag or pennant chart pattern. Once the handle is complete, the stock may breakout to new highs and resume its trend higher.
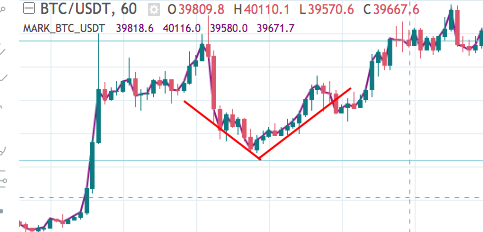
Single bottom, looks like the letter V and occurs when price tries to push through a support level, is denied, and makes a second unsuccessful attempt to breach the support level.
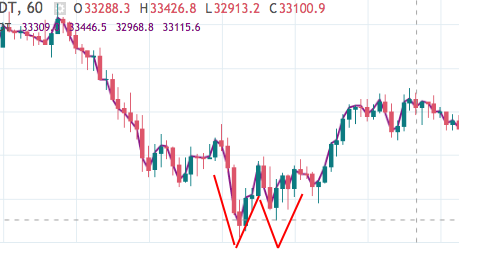
A double bottom, looks like the letter W and occurs when price tries to push through a support level, is denied, and makes a second unsuccessful attempt to breach the support level.
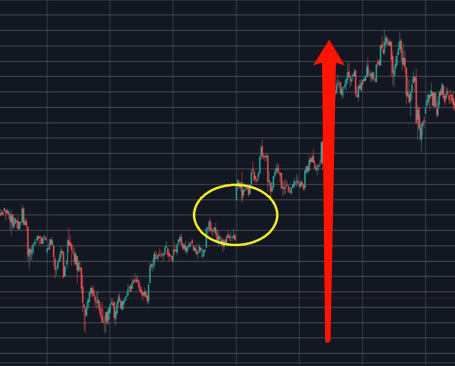
Gaps occur when there is empty space between two trading periods that’s caused by a significant increase or decrease in price.
Flags are constructed using two parallel trendlines that can slope up, down or sideways (horizontal).
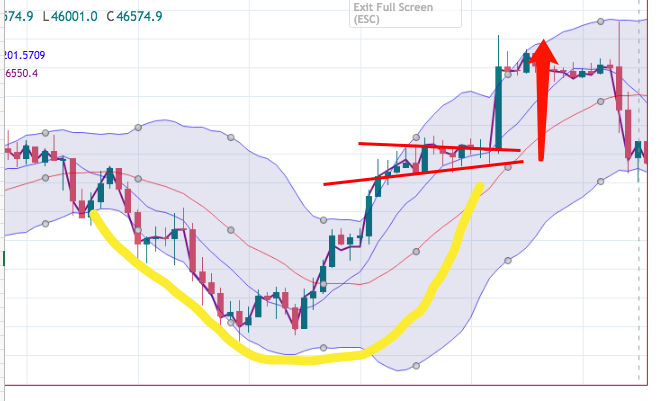
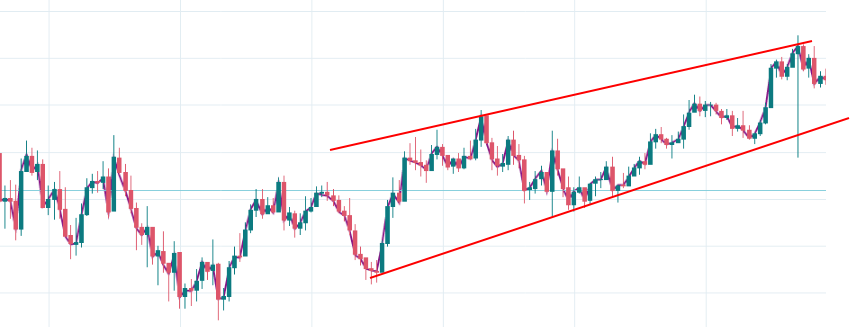
Ascending Triangle Pattern
Ascending triangles are characterized by a flat upper trend line and a rising lower trend line and suggest a breakout of higher position.
Wedges are similar to pennants in that they are drawn using two converging trendlines; however, a wedge is characterized by the fact that both trendlines are moving in the same direction, either up or down.
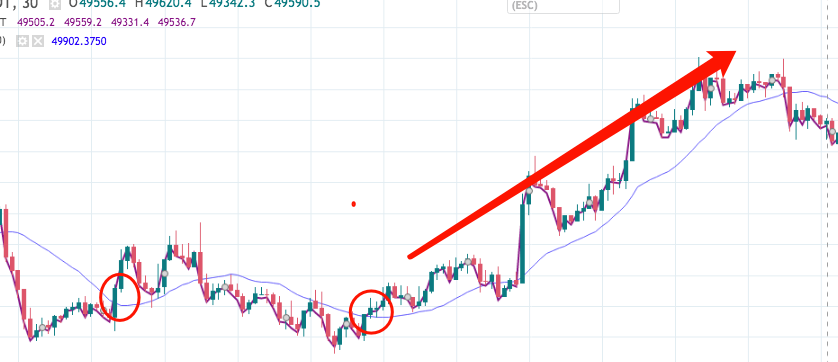
Break MA(20),When the price has gone through a round of decline, it is no longer to fall, and the price will surely rebound. When it breaks through the 20-day Moving Average after adjustment and is in heavy volume, this is the technical buying point.
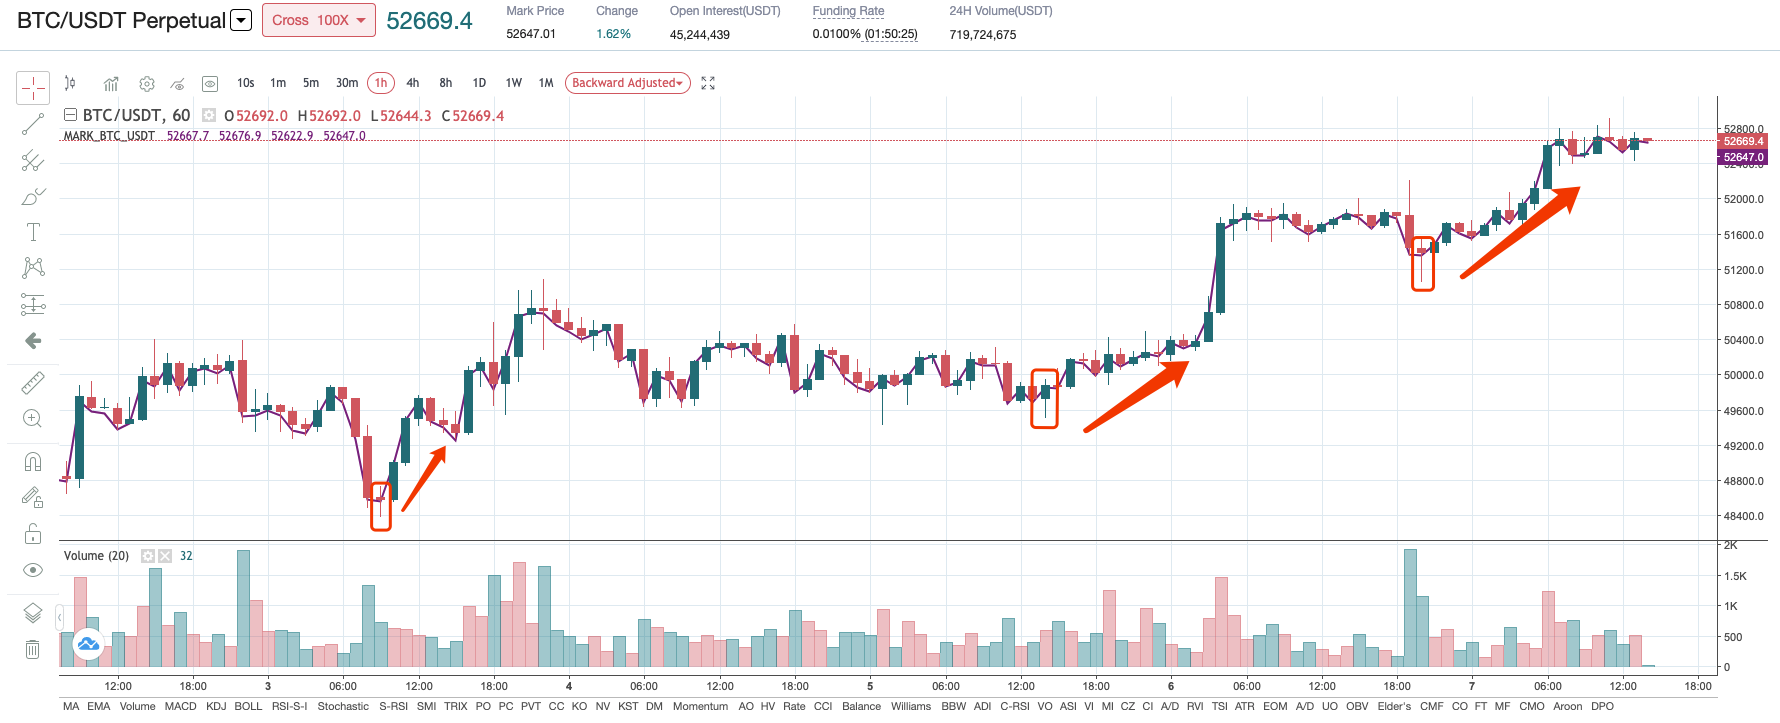
3 long candlewicks in a row at the bottom, it's like the dogi at the bottom
Q: Wow, the drawings above are really magical.
A: Right, it is not the art drawing, but a visionlly and intuitively tool for the analysis.
Today is Part 1 for K-Line Pattern Uptrend, next time we will continue to present Downtrend.
Q: Ok, thanks all for today, let's go to Question Session.
🔑 Register an account with Gate.io
👨💼 Complete KYC within 24 hours
🎁 Claim Points Rewards
