


🔑 Register an account with Gate.io
👨💼 Complete KYC within 24 hours
🎁 Claim Points Rewards
Your Gateway to crypto news and insights
Q: What is the definition of MA - Moving Average?
A: A Moving Average (MA) is an indicator that is commonly used in technical analysis.
A Moving Average (MA) is a calculation that takes the arithmetic mean of a given set of prices over the specific number of days in the past; in GATE.IO, we measure it by 9 or 20 days.
1.A Moving Average is a technical indicator that investors and traders use to determine the trend direction.
2.It is calculated by adding up all the data points during a specific period and dividing the sum by the number of time periods.
3.Moving Average help technical traders to generate trading signals.
Q: Where to change the time frame in the platform?
A: Please check below pictures:
Click setting and the below box pop out, change the number in "Length" for different time frame, 9, 15, 20, 50, 60, 200...
Q: How to read MA?
A: A rising Moving Average indicates an uptrend, while a declining Moving Average indicates a downtrend.
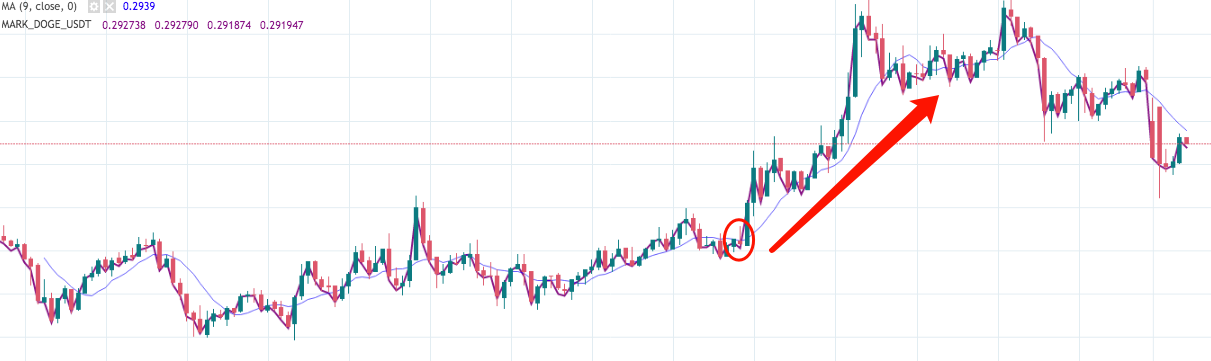
1.Please see below blue MA line going through the K patterns. The arrows show out Uptrend or Downtrend.
2.And let's go further to check the cross to recognize UP or DOWN.
At the left side of above picture, MA line crosses K line but above it, shows the signal of downtrend. At this moment, usually to SELL(Short).
At the right side, MA line crosses K line but below it, shows the signal of uptrend. At this moment, usually to BUY(Long).
Q: We always heard Golden Cross and Dead Cross, could you show me?
A:
1.Golden Cross is a Bullish signal. Price enters an uptrend: Many professional traders use Moving Average to confirm the direction of the trend. To determine which side in the trade that we should be on If the trend is up, it is on the long side and if the trend is down, it will be on the short side.
See below picture:
2.Death Cross, is a technical signal indicating that Market may be reversing to a downtrend. Contrary to the Golden Cross signal.
See below picture:
Q: What is the meaning of choosing different time frame?
A: Moving Averages(MA) is a totally customizable indicator, which means that an investor can freely choose whatever time frame they want when calculating an average.
The most common time periods used in Moving Average are 9, 15, 20, 30, 50, 100, and 200 days.
The shorter the time span used to create the average, the more sensitive it will be to price changes.
The longer the time span, the less sensitive the average will be.
Q: How to compare the sensitivity of the time frame?
A:
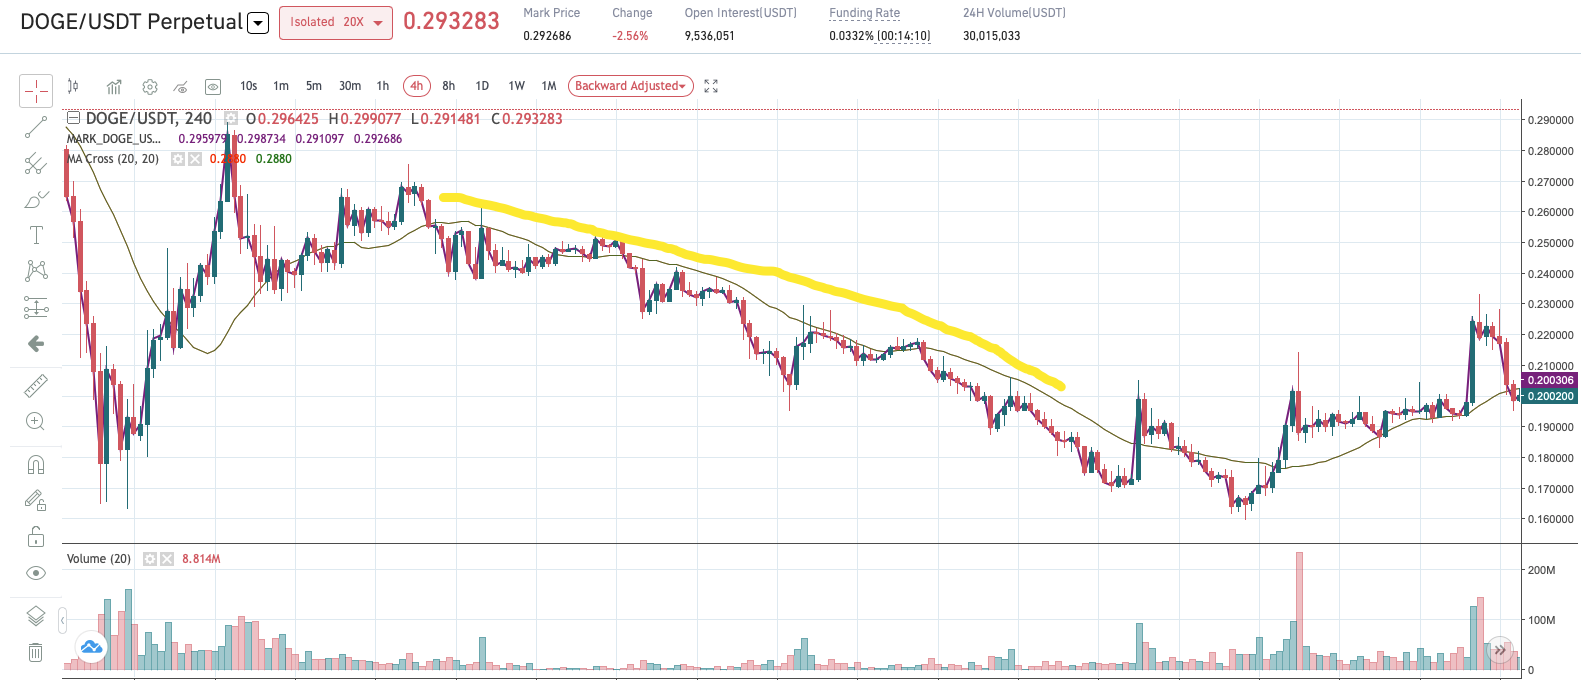
1.MA 9-Day, close to K lines, creates a lot of CROSS. Traders will need to react very frequently, suit to short term trade.
2.MA 20-Day, the gap is bigger from K line. The number of CROSS is mush less than 9-Day. More suit to long term trade.
Q: What is the most common time frame for MA?
A: GATE.IO suggest to use 9 or 20 days. The 20-period Moving Average is in the sweet spot of not too short and not too long of a look back period.
Q: Why should be 20-Day?
A: 20 is not magical number, it is an intermediate lookback period for the Moving Average.
1.A long Moving Average(e.g., 200-period) may lags too much, as longer the time span, the price is not sensitive at all.
2.A short Moving Average (e.g., 3-period) is almost like price itself, the shorter the time span, the price is too sensitive and can't get the reasonable analysis result.
Q: Seems 20-Day MA is very helpful, is it accurate all the time?
A: It is the question that all the new users would like to ask. Let's see the conclusions below.
1.MA follows the price trend but lags behind it.
2.MA allows you to observe how it interacts with price action, to determine the stop-loss.
3.Bollinger Bands also has SMA(Simple Moving Average) as middle band, typically using a 20-day calculation. The upper and lower bands are typically 2 standard deviations +/- from SMA.
Q: Does it mean we can't use 60, 200 days to measure?
A: Not really, as the time frame is according to how the traders would like to measure.
1.MA 60-Day, if the price moves significantly below the 60-period Moving Average, it's commonly interpreted as a trend change to the downside.
2.MA 200-Day, can be used to identify key levels in the market that have been respected before. Oftenly, the price will approach and bounce off the 200-Day MA and continue in the direction of the existing trend. Therefore, the 200-Day MA can be viewed as dynamic support or resistance.
Q: From the media analysis, always mention "Support" and "Resistance". How we read it from MA?
A:
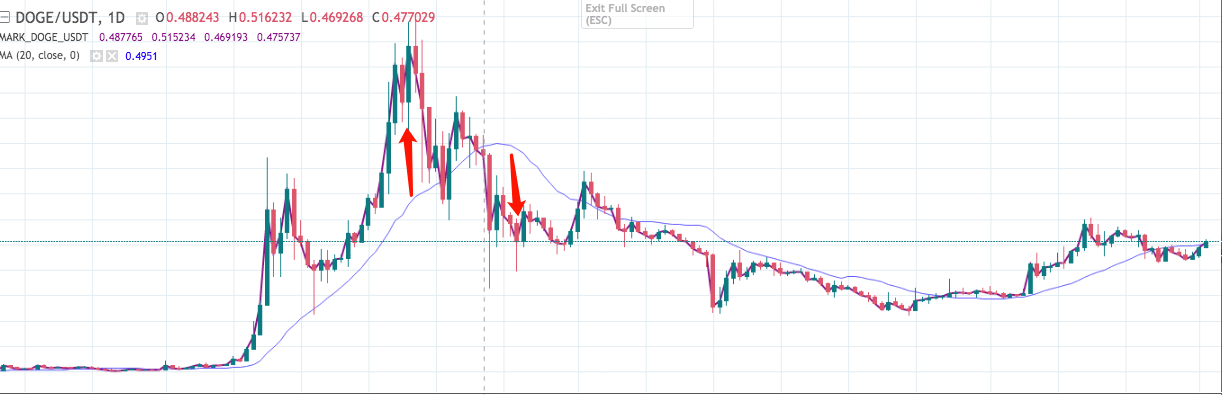
1."Resistance", usually above K lines, means the price have been pushing up continuously but didn't break the upper limit. This calls Resistance, and please keep on observing a good timing to SELL. Please see below picture.
2."Support", usually below K lines, means the price has been dropping down continuously but didn't break the bottom limit. This calls Support, and please keep on observing a good timing to BUY. Please see below picture.
Q: Seems MA is not real-time indicator.
A: You are right. Actually all the indicators are not real-time.
And please keep in mind, that all indicators often provide false signals and should thus be used with other technical analysis indicators.
When all the tools you’ve used indicate the same direction, this increases the probability of the success of the trade.
Q: Thanks for all above for today, let's get to Question Session.
🔑 Register an account with Gate.io
👨💼 Complete KYC within 24 hours
🎁 Claim Points Rewards
