


🔑 Register an account with Gate.io
👨💼 Complete KYC within 24 hours
🎁 Claim Points Rewards
Your Gateway to crypto news and insights
Gate.io AMA - More Details About Candlesticks, Part 2
Q: Today let's talk about more details about candlesticks after Part 1.
A: Let's go through it.
Continuing from previous AMA, we will introduce more candlesticks.
Piercing Line
1.It is a bullish pattern that shows the reversal signal to uptrend.
2.The 2nd bullish candle covers 1st bearish candle.
3.Bullish candle covers the gap from 1st bearish candle.
From the below picture, Piercing Line appears at the bottom of downtrend and it shows the signal of uptrend.
DARK CLOUD
1.It is a bearish candlestick, 2nd bearish candle covers the 1st bullish candle.
2.Bearish candle covers the gap from 1st bullish candle.
3.It is the reversal pattern from Piercing Line.
4.We call it Dark Cloud, because it looks like clouds cover the sun.
From below picture, Dark Cloud appears at the top of uptrend and it shows the signal of downtrend.
Bullish Meeting Line
1.This pattern is similar to Piercing Line, but it shows the weaker signal of Bullish.
2.The 2nd bullish candle not covering 1st bearish candle completely, the gap between close price of 1st bearish candle and close price of 2nd bullish candle is very little.
3.It shows the buying power is not strong enough to cover selling power.
From the below picture, Bullish Meeting Line appears at the bottom of downtrend and it shows the signal of uptrend.
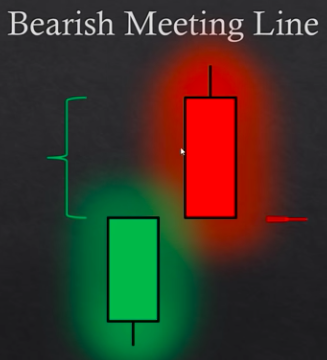
Bearish Meeting Line
1.It is a weaker signal Bearish pattern, but similar to Dark Cloud.
2.The 2nd bearish candle can't cover 1st bullish candle.
3.It shows the selling power is not strong enough to cover buying power.
From the below picture, Bearish Meeting Lines appears at the top of uptrend and it shows the signal of downtrend.

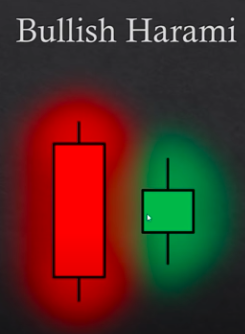
Bullish Harami
1.From the name, it is a Bullish candlestick.
2.Harami means the pregnant in Japanese.
3.2nd bullish candle is almost the length of the mid of the 1st bearish candle. It looks like the baby is going to be born.
4.Small candle body means the open position of bullish candle covers the close position of bearish candle.
5.It shows the new uptrend is going to be born.
From the following picture, Bullish Harami appears at the bottom of downtrend and it shows the signal of uptrend.
Bullish Harami Cross
1.It is a weaker bullish signal from Bullish Harami.
2.As the doge is not showing the clear trend but in Green body, so it is only showing the weaker possibility of uptrend.
Bearish Harami
1.It is totally the mirror or Bullish Harami.
2.2nd bearish candle is almost the length of the mid of the 1st bullish candle.
3.Small candle body means the close position of bearish candle covers the open position of bullish candle.
4.It shows the new downtrend is going to be born.
From the following picture, Bearish Harami appears at the top of uptrend and it shows the signal of downtrend.
Bearish Harami Cross
1.It is a weaker bullish signal from Bearish Harami, mirror of Bullish Harami Cross.
2.As the doge is not showing the clear trend but in Red body, so it is only showing the weaker possibility of downtrend.
Q: And below let's study two prominent candlesticks.
A:
Bullish Kicking
1.It is a straightforward bullish pattern.
2.The open position of bullish candlestick has big gap from the open position of bearish candlestick.
3.It implies the strong buyer power totally kick off the selling power.
4.It appears at the bottom of downtrend and directing to the uptrend.
Bearish Kicking
1.It is the mirror pattern of Bullish Kicking.
2.The open position of bearish candlestick has big gap from the open position of bullish candlestick.
3.It implies the strong selling power totally kick off the buying power.
4.It appears at the top of uptrend and directing to the downtrend.
Q: There are two words that should be noticed with super attention:
Soldiers
Usually imply the uptrend, appear at the bottom of downtrend.
Crows
Usually imply the downtrend, appear at the top of uptrend.
Soldiers
Bullish Two Soldiers
Three White Soldiers
Crows
Bearish Two Crows
Three Black Crows

Conclusion:
1.Basically if you see the continuous bullish or bearish candlesticks, there's the signal of reversal pattern.
2.No matter in which form, continuous bullish or bearish candlesticks shows the reversal powers is covering the current power.
Q: That's all for today.
🔑 Register an account with Gate.io
👨💼 Complete KYC within 24 hours
🎁 Claim Points Rewards
