


🔑 Register an account with Gate.io
👨💼 Complete KYC within 24 hours
🎁 Claim Points Rewards
Your Gateway to crypto news and insights

Hammer candlestick is among the most popular tools in technical analysis that can assist price action traders in detecting potential reversals following bearish or bullish movements.
These candle patterns may show a bullish reversal at the end of a downtrend or a bearish reversal after an uptrend, depending on the context and timeframe.
When combined with other technical indicators, Hammer candles can provide traders with good entry points for long and short positions.
The bearish hammer and inverted hammer candles appear after a downtrend and are examples of bullish hammer candles. The shooting star and hanging man are bearish variations of hammer candles that arise after an uptrend.
The hammer candlestick pattern is a commonly used candlestick pattern by traders to interpret the price action of the market. Price action traders commonly use this candlestick to identify reliable price reversal points. Furthermore, this candlestick is effective across all financial markets, including forex, stocks, indices, and cryptocurrencies.
Trading in the financial market necessitates a thorough understanding of technical and fundamental analysis. The ultimate goal is to determine the price direction using price action analysis. Traders will profit if everything is done correctly. On the other hand, finding the price direction necessitates complex analysis and multiple confirmations using trading tools such as candlesticks, price patterns, and trend recognition.
The hammer pattern is a bullish reversal that appears following a long bearish trend. It has a small body with a long lower shadow. It is a price pattern in which the opening and closing prices are close, indicating that bears have become active, but the price remains close to the opening level.
Observing how the candlestick forms, the hammer candlestick pattern tells a story about market supply and demand. A long lower shadow indicates sellers reduced the price but could not hold it at the new low. Later, buyers joined the cost from the low, successfully bringing it close to the daily opening level. In general, the hammer appears after the price of an asset has fallen.
When hammer candlestick patterns appear, it may indicate that a potential reversal or market sentiment is about to change. As a confirmation, the price must show momentum after the hammer pattern.
The hammer pattern comprises a single candlestick with a small body. A hammer candlestick's body can be either:
Green (bullish), when the candle closes higher than the open.
Or red (bearish) when the candle closes lower than the open.
The color of the candlestick has little significance because the hammer candlestick pattern always indicates a bullish signal regardless of the candle's body color.
A hammer candlestick's main event occurs in the lower shadow. As a result, the candlestick's success rate is determined by how long the wick is compared to the candle's body. A good hammer pattern should have a wick double the body's size.
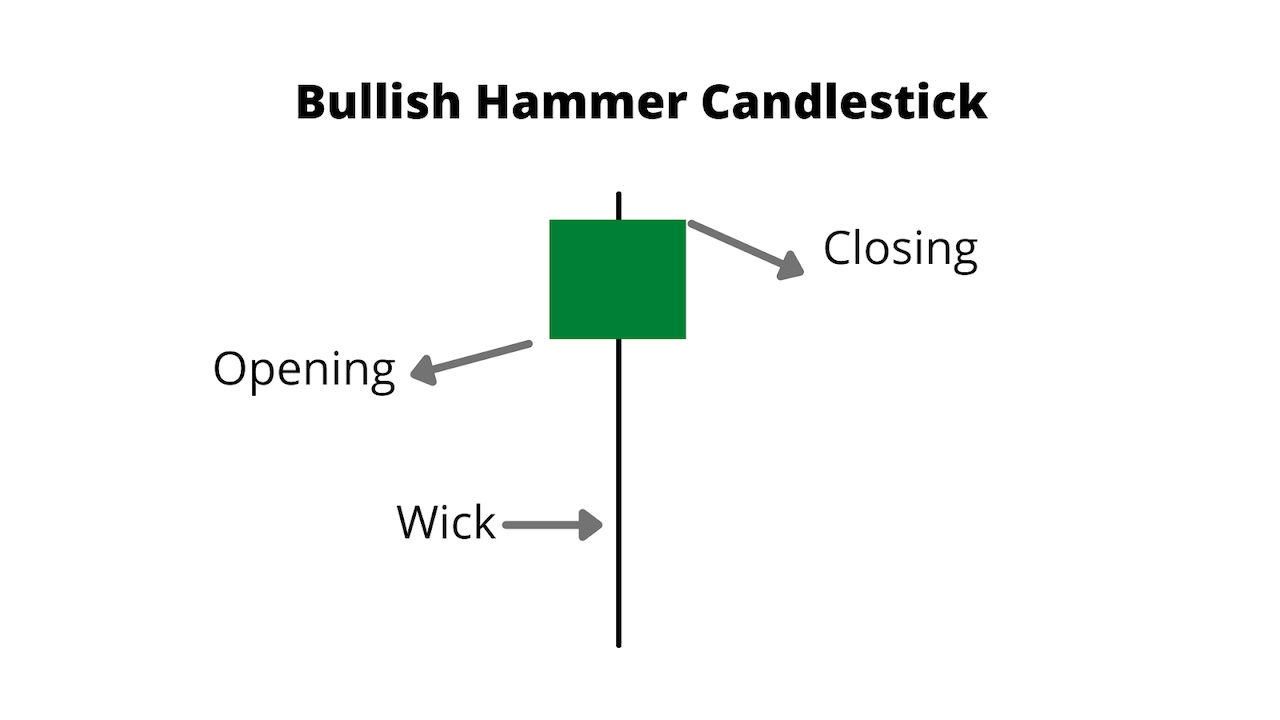
When the closing price is sky-high compared to the opening price, a bullish candlestick hammer forms, this candlestick depicts that buyers have control of the market before the end of the trading session. The closing price and leg length determine the success rate of the bullish hammer. The most accurate trade has a long wick and a closing price higher than the opening price.

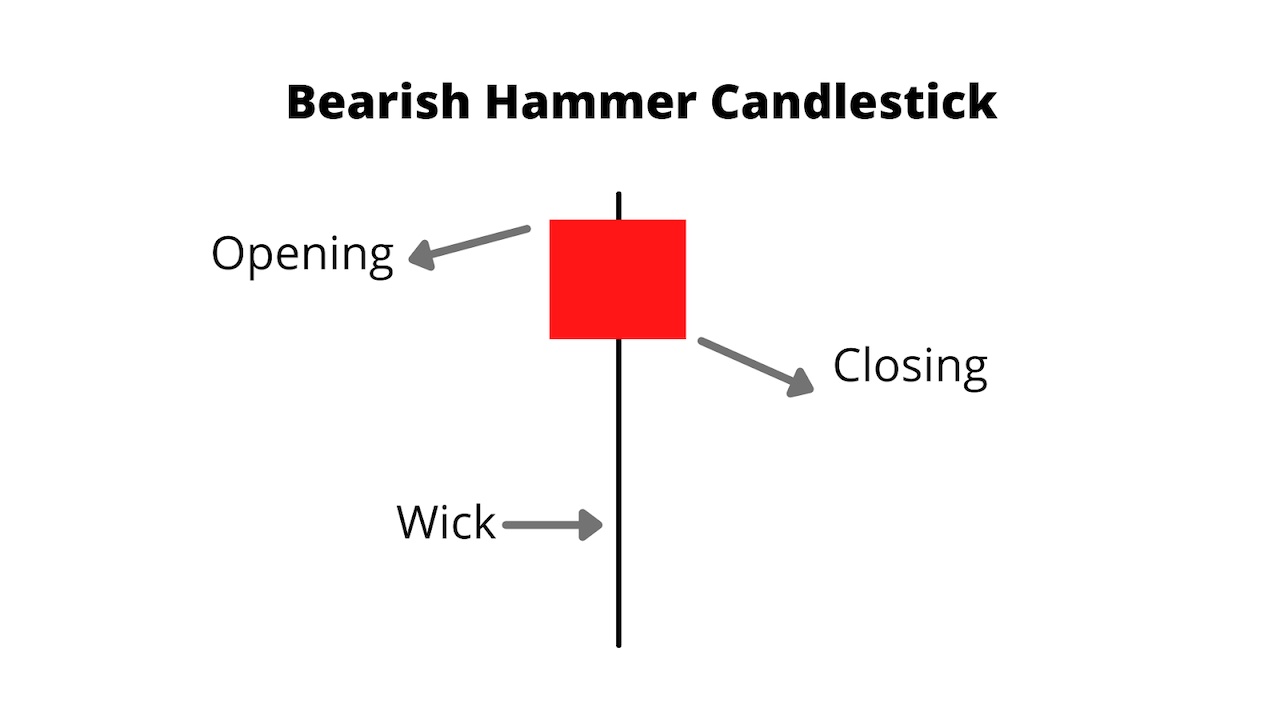
The bearish hammer candlestick is also known as the hanging man candlestick. It happens when the opening price exceeds the closing price, producing a red candle. The wick on a bearish hammer indicates selling pressure, indicating a potential downside reversal. In contrast to the bullish hammer, the bearish hammer appears after a long downtrend, and its closing price remains lower than the opening price. On the other hand, the bearish hammer provides a weaker buy signal than the bullish hammer.
Let's take a look at the bearish hammer:

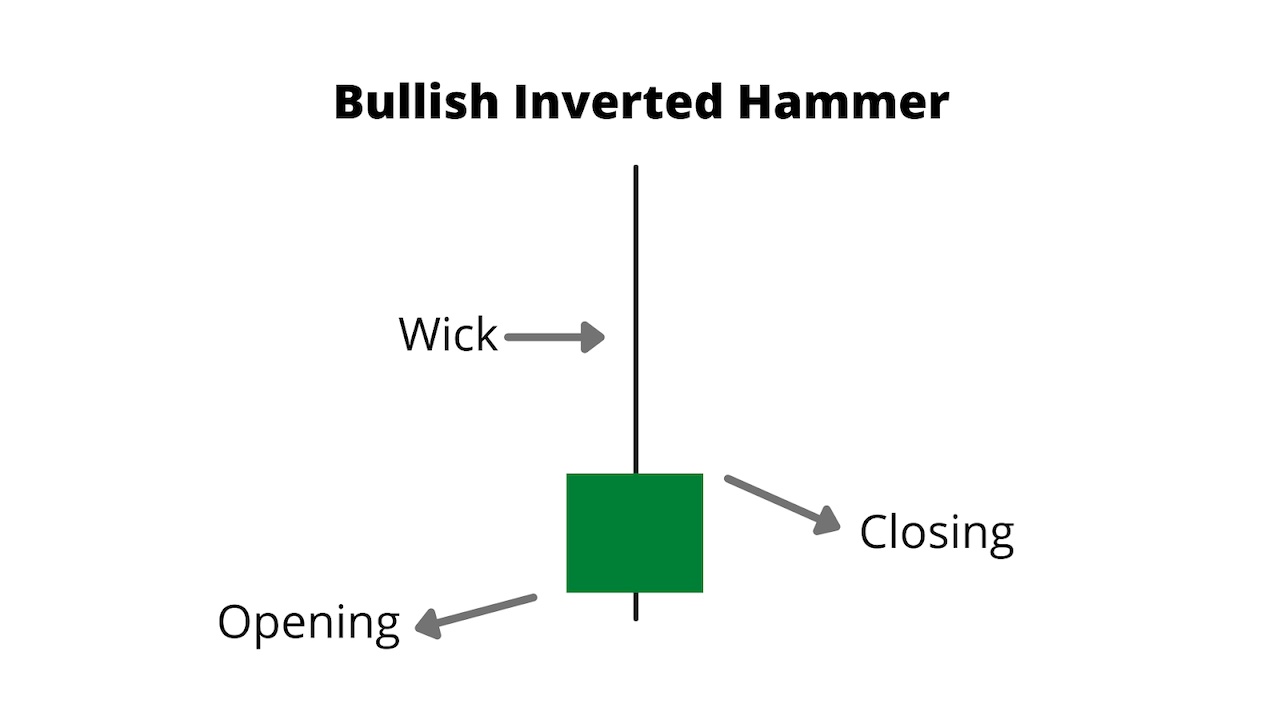
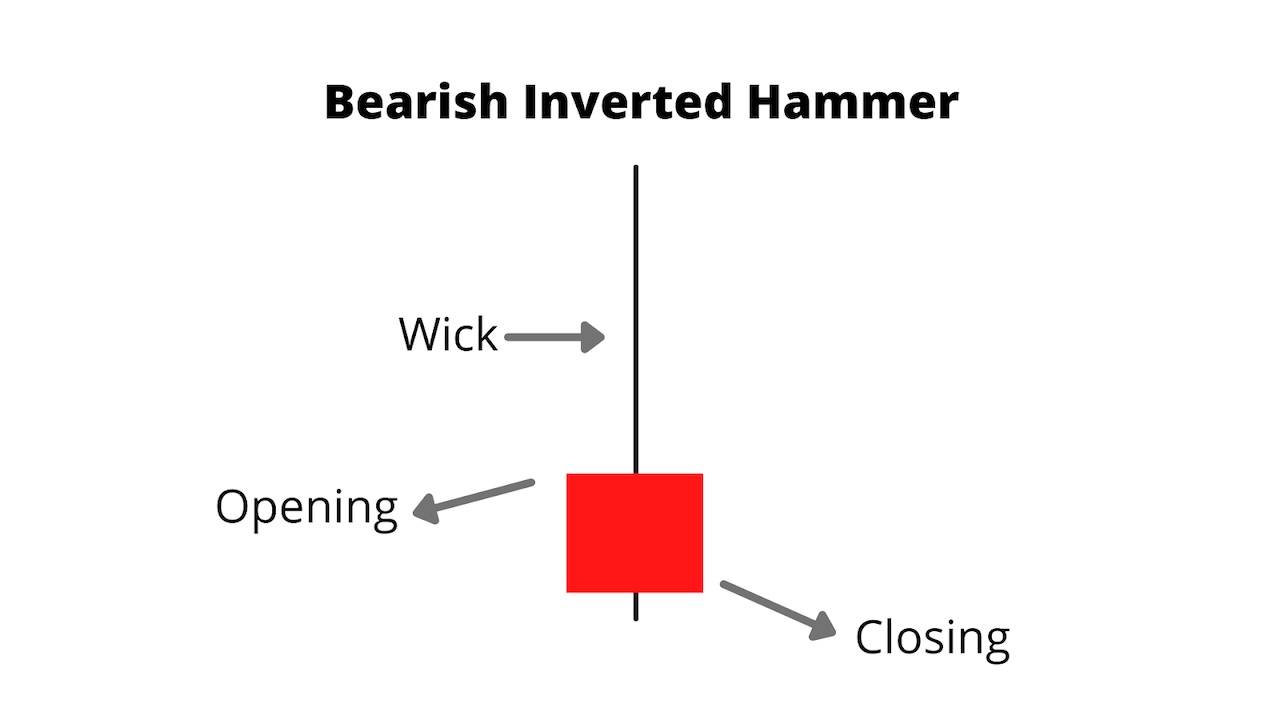
When the opening price is below the closing price, an inverted hammer forms, and the long wick above the body indicates that buying pressure pushed the price up, but it was eventually dragged back down before the candle closed. This inverted hammer candle pattern, while not as bullish as the regular ones, is a bullish reversal pattern that appears after a downtrend.

A shooting star candlestick is known as a bearish inverted hammer. It has the same appearance as a standard, inverted hammer but indicates a potential bearish reversal rather than a bullish one. In other words, shooting stars' candlesticks resemble inverted hammers that form following an uptrend. They start when the opening price is sky-high than the closing price, and the wick indicates that the upward market movement is coming to an end.

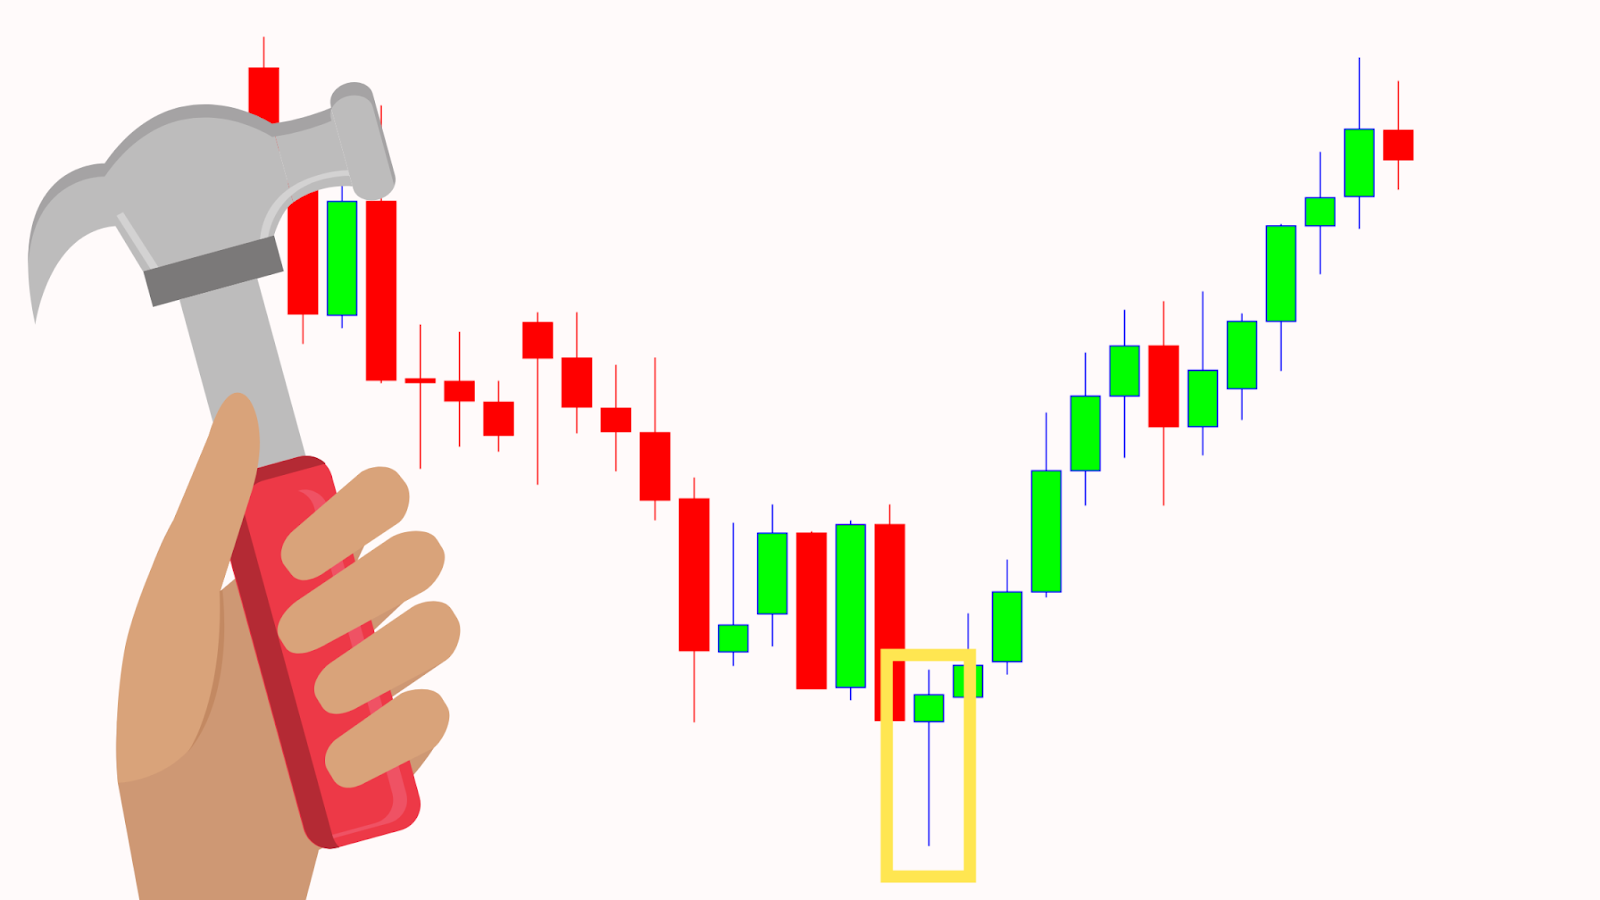
Market trends are created and changed by global financial market cycles. The majority of significant top-bottom results from solid fundamental news, but cryptocurrency is also affected by global economic conditions, regulatory conflict, crypto acceptance, and other factors. The first criterion for this strategy is the identification of a strong downtrend that has broken all near-term lows.

In the above image, a daily ETH chart, the price moves lower, breaking below the near-term low of 1800.00.
When the price makes a new low, it exhibits the first sign of impending bullish pressure in the form of an indecision candle. Later, bears attempt to lower the price but fail, and the market closes with a bullish hammer.

A buy-stop order exceeding the hammer's high price, with a stop-loss under the shadow and some buffer, is the perfect entry for this trading strategy.
Support and resistance levels act as price barriers, and significant price movement occurs when the price breaks above or below these levels. On the other hand, the financial market moves like a rubber band, barely breaking the support and resistance bands unless there is significant news to break the chain.

The ETH intraday chart above shows $2,332.97 as support and resistance to the price. The price approaches the resistance level and breaks through it under intense buying pressure. Later, the price falls to the support level, where investors should wait for confirmation before entering a buy order.

When a hammer candlestick appears at the support level — the stop loss below the shadow with some buffer — the buy position becomes valid. As soon as a pin bar appears at the resistance level, the trade closes with a 1:2 R: R.
The hammer pattern can show a consistent price trend in all financial markets, including forex, cryptocurrencies, stocks, and indices.
The hammer works well with other price action tools such as the moving average, support, resistance, trend, etc.
Traders can use the hammer as a trend continuation and a reversal pattern.
Following a long bearish trend, the hammer has a better chance of indicating a solid market reversal.
The hammer has bullish and bearish formations, which aid in identifying trend reversals.
The price may fall even if the candlestick appears following a long bearish trend.
Traders should not rely solely on a hammer to determine price direction.
Although the hammer candlestick pattern can help traders spot potential trend reversals, it is not a buy or sell signal in and of itself. Like other trading strategies, Hammer candles are more useful when combined with other analysis tools and technical indicators.
If you trade cryptocurrencies, always use strict money management rules and other indicators in addition to the hammer. You must first understand the market context to develop an optimal trading strategy. Develop a trading strategy that incorporates multiple trading tools with proven track records. Of course, there are numerous candlestick patterns; always choose the one that best suits you.
Author - M. Olatunji, Gate.io Researcher
Disclaimer:
* This article represents only the views of the observers and does not constitute any investment suggestions.
*Gate.io reserves all rights to this article. Reposting of the article will be permitted provided Gate.io is referenced. In all other cases, legal action will be taken due to copyright infringement.
🔑 Register an account with Gate.io
👨💼 Complete KYC within 24 hours
🎁 Claim Points Rewards
