


🔑 Register an account with Gate.io
👨💼 Complete KYC within 24 hours
🎁 Claim Points Rewards
Your Gateway to crypto news and insights
The Coppock Curve Indicator enables traders to identify long term trends and momentum.
It indicates long term trade entry and exit points for cryptocurrencies, commodities , forex and stock.
Any value above zero signifies a buy signal while the one below zero is a sell signal.
Combining the Coppock Curve Indicator and the relative strength index (RSI) provides more reliable signals than using it without confirmations.
There are dozens of trading technical indicators you can think about. The good thing is that these indicators work well in stock trading as they do with crypto trading. Nevertheless, it is best to come up with a suitable combination of the indicators and use them alongside the asset’s price action. The Coppock curve indicator is an indicator which traders can use to analyze price changes in real time. In this article, we explore how crypto traders can use the Coppock Curve indicator alongside other technical analysis indicators.
What is Coppock Curve?
Developed by Edwin Sedge Coppock in 1962, the Coppock Curve indicator is a long term momentum indicator that indicates buying opportunities of an asset, such as cryptocurrency. This indicator signals major price reversal points of an asset, thereby enabling the traders to spot when to enter and exit a trade.
Also called the Coppock Guide, the Coppock Curve indicator was designed to help generate signals for position trading rather than swing or day trading. However, many day and swing traders also use this tool with much success. Structurally, the Coppock Curve indicator (CC) is also a momentum oscillator that swings above and below the zero line, generating buying signals in the process.

Source: Earnforex
Edwin Sedge Coppock designed this indicator to help traders to identify buying signals. However, there are some shrewd traders who use it to identify sell signals. Basically, this indicator is based on the arithmetic moving average and uses a 14 month period.
As background information, Edwin Coppock was an economist and entrepreneur based in San Antonio, Texas in the United States. He is well-known for being the founder of Trendex Research and a member of the Episcopal Church.
His religious background helps us to understand how he derived the 14 month period. It all started after Coppock asked his pastor the length of the normal grieving period after the death of a loved one. The pastor told him that humans take an average of 11 to 14 months of grieving. Based on this information, Coppock theorized that traders also have a similar grieving period following a downturn of a stock market.
How to calculate the Coppock Curve?
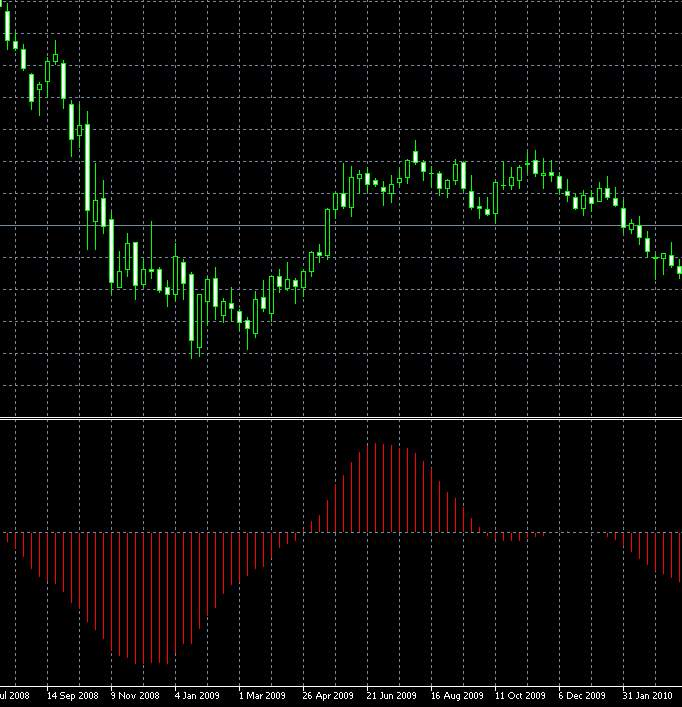
The Coppock Curve indicator is based on a 10-month weighted moving average of the sum of the 14-month rate of change and 11-month rate of change. The basic buying opportunity exists when the Coppock value drops below zero and rebound into the positive zone.
Here, the rate of change refers to the difference between the present day’s closing price of the asset multiplied by periods ago, divided by the closing price multiplied by periods ago. The following formula contains the same information.
Coppock Curve = Weighted moving average (10) of (11-month ROC + 14-month ROC)
Now, we need to understand how to calculate the rate of change. Here is the formula.
Rate of change = [Closing Price (today) – Closing Price (X periods ago)] / Closing Price (X periods ago)
Keep in mind that the weighted moving average assigns more weight to recent data than to past one.
How to trade using the Coppock Curve indicator?
First off, there is a zero line which demarcates the positive territory and the negative one. In fact, the positive territory is above the centre zero line while the negative one is below it. When the Coppock Curve crosses into the positive territory it is a buy signal. On the other hand, when the curve crosses down the centre line, it is a sell signal.

However, there are certain things traders need to know when using the Coppock Curve. It is wiser to take a buy or sell action when the value is closer to 0 than when it is further away from it. For instance, if the value is far above 0, such as +35, it means that the market is already in an uptrend and it is not wise to enter a trade position.
On the contrary, if the value is far below 0, like -35 it is not a buy signal. This is because the downtrend may continue for some time. It is best to buy when the value first drops below 0 and then starts rising again. However, if the value stays above zero it is a signal for you to hold your cryptocurrency.
Multi-timeframe analysis approach
Yes, traders can use a multi-timeframe analysis using the Coppock Curve indicator to establish the best trade entry points. Here, the trader uses a longer time frame to spot potential long term bullish momentum. He/she then shifts to a short timeframe to spot the exact trade entry point.
As an instance, the trader can identify a bullish trend using the weekly chart (a point just after 0). He/she then uses the 4 hour time frame to spot the entry point, just after the indicator crosses above the zero.
Combining the Coppock Curve with other indicators
It is essential to note that you can use the Coppock curve indicator with other indicators such as the relative strength index (RSI) and MACD. Let’s illustrate how a trader can use the Coppock Curve alongside the RSI.
A trader can initiate a trade when the Coppock Curve indicator enters a positive zone while the RSI is above the 50 line. Contrarily, he/she exits the trade when the indicator crosses below the zero line.
How to use the Coppock Curve at Gate.io
After the above explanation regarding the use of the Coppock Curve indicator, it is time to show you how to set the indicator on Gate.io. You find all the indicators below every chart on the platform. As a result, you click the indicator you want to add to your chart such as the Coppock Curve Indicator. As a fact, Gate.io uses the abbreviation of Coppock Curve Indicator, which is CC. Therefore, to incorporate the Coppock Curve indicator on the chart click CC as indicated below.

In the next chart you can see the Coppock Curve indicator on your chart.

Source: Gate.io
The Coppock Curve Indicator is a long term momentum indicator. Originally, Edwin Sedge Coppock created the indicator to help traders identify long term trade entry points. Traders can use it for the stock market as well as the crypto one.
Author: Mashell C., Gate.io Researcher
This article represents only the views of the researcher and does not constitute any investment suggestions.
Gate.io reserves all rights to this article. Reposting of the article will be permitted provided Gate.io is referenced. In all cases, legal action will be taken due to copyright infringement.
🔑 Register an account with Gate.io
👨💼 Complete KYC within 24 hours
🎁 Claim Points Rewards
