


🔑 Register an account with Gate.io
👨💼 Complete KYC within 24 hours
🎁 Claim Points Rewards
Your Gateway to crypto news and insights
Any successful cryptocurrency trader should have the expertise to predict price reversals since they help in timing trade entries and exits. Analyzing changes in trading volume and price action enables traders to identify potential reversal points. The on-balance volume (OBV) is a metric which traders use to evaluate changes in trading volume. In this article, we focus on how a trader analyzes trading volume to make vital trading decisions.
What is On-balance volume (OBV)?
The on-balance volume is a technical analysis indicator which shows the direction of price movements using trading volume. It uses the increase or decrease in trade volume of an asset to predict the possible direction of its price. Essentially, it tracks the change in trade volume of an asset within a period, especially 24 hours.
Joseph Granville developed this trading technical tool during the 1960s. In fact, he wrote about it in Granville’s New Key to Stock Market Profits in 1963. Traders can use it to analyze stock, commodities and cryptocurrency price movements. The OBV uses cumulative volume figures to gauge an asset’s buying and selling pressure in the market.

Source: Stockmaniacs
How to calculate On Balance Volume (OBV)
The on balance volume is derived from the addition or subtraction of the daily volume to the existing one. If today’s asset price is higher than yesterday's the volume is added to the existing figure (OBV). On the contrary, if today’s price is lower than yesterday’s the volume is subtracted from the existing one. However, if today’s closing price is the same as yesterday’s there is no change in the existing OBV value.
Based on the above explanation, we have three formulae for calculating the On Balance Volume (OBV).
If today’s closing price is higher than yesterday’s, we use the formula:
If today’s closing price is less than yesterday’s, we use this formula:
If today’s closing price is the same as yesterday’s closing price we use this one:
Let’s use an example to illustrate how you can calculate the OBV.
Day 1 = $100.00 crypto price; volume = 5 000
Day 2 = $110.00 crypto price; volume = 7 000
Day 3 = $105.00 crypto price; volume = 10 000
Day 4 = $120 crypto price; volume = 12 000
Day 5 = $115 crypto price; volume = 15 000
Calculations
Day 1: OBV = 0
Day 2: OBV = 0 + 7 000
Day 3: OBV = 7,000 – 10, 000 = -3,000
Day 4: OBV = -3,000 + 12, 000= 9,000
Day 5: OBV = 9,000 +15, 000 = 24,000
However, there is no need to manually calculate the on-balance volume since the software on trading platforms does that for you. What is important is for you to interpret the graphs.
General trends of OBV
When the OBV is rising it shows us that the number of up days is more than those of down days. This shows that the uptrend will continue.
If the OBV is falling it means that the number of up days is less than the down days. This shows that there are more sellers than buyers in the market.
According to the developer of the OBV indicator, Joseph Granville, there are two major volume trends which are uptrend and downtrend. During an uptrend the OBV indicator moves in the same direction as the price of the asset. This means that both the OBV and the price move upwards, making higher highs and higher lows. In this case, the volume supports the price and this is a bullish continuation signal.
During a downtrend, both the volume and price of the cryptocurrency move in the same direction. However, this time they make lower highs and lower lows. In the same manner, the volume supports the price of the asset. Therefore, this is a bearish continuation signal.

Source: Daytradertheworld
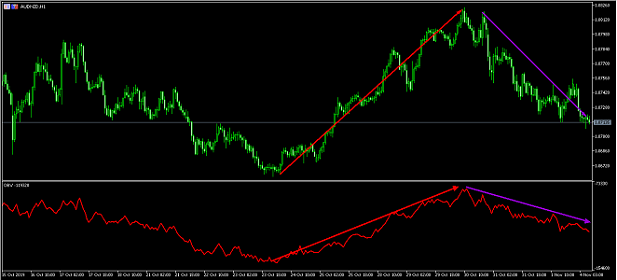
However, there are times when the volume does not move in the same direction as the price. This occurs when the price of the asset and the OBV line move in opposite directions. In this case, there is a divergence. When the price of the asset moves in the opposite direction as its volume it is an indication of a possible trend reversal.
As an example, if the price of the asset is rising while the volume is falling it shows that the buying pressure of the asset is decreasing. This is called a bearish divergence. In this circumstance, most traders sell their assets.
If the volume of the asset is increasing while its price is falling it shows bullish momentum. Since this is a bullish divergence, we expect the price to increase and traders to go long.
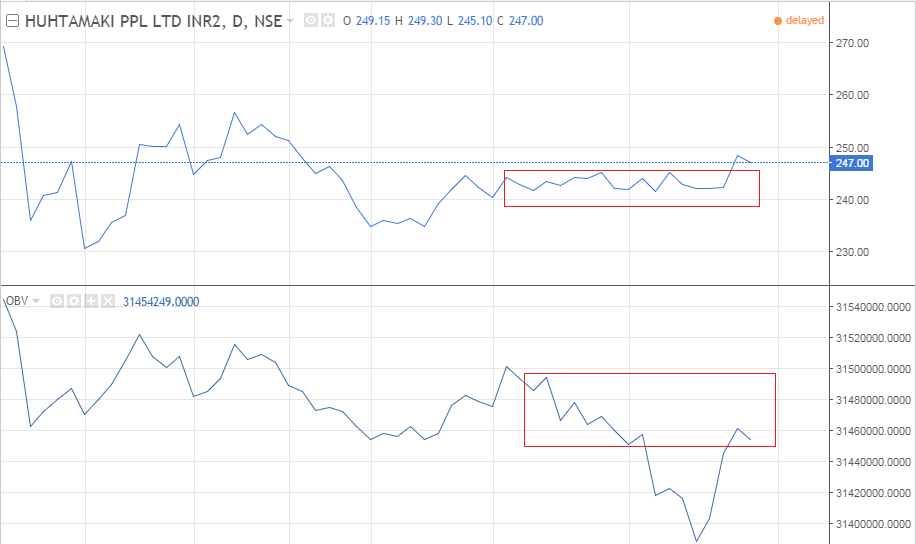
Non-confirmation uptrend
With non-confirmation uptrend, the price will rise and make a new higher top while the volume fails to make a new higher top. This shows that the volume does not support the price. That type of non-confirmation takes place at the end of an uptrend.

Source: Elearnmarkets
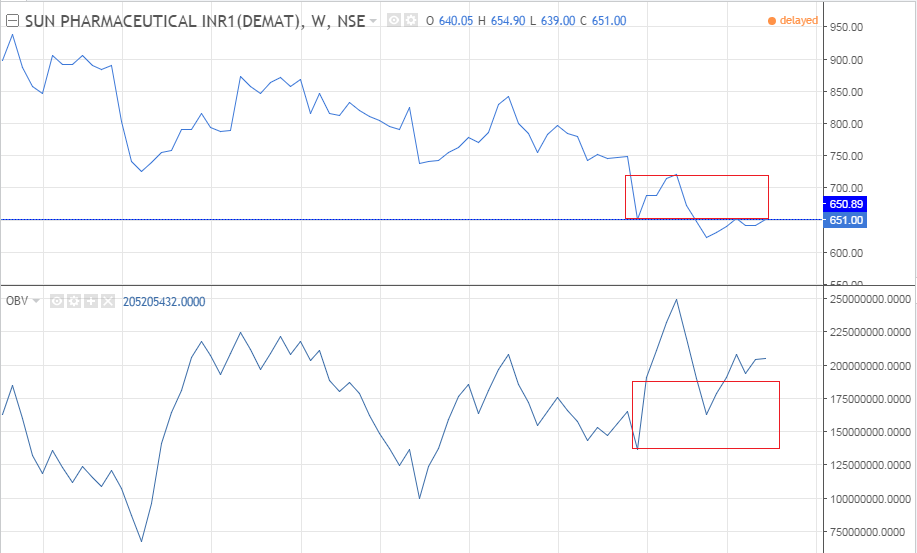
This is another case where the price of the asset and its volume do not move in the same direction. For example, the price may move downwards and break the last bottom while the volume does not reach a similar bottom. In other words, the volume has not decreased at a similar rate as the price. As such, the volume does not support the price. This situation occurs during a downtrend.

Source: Elearnmarkets
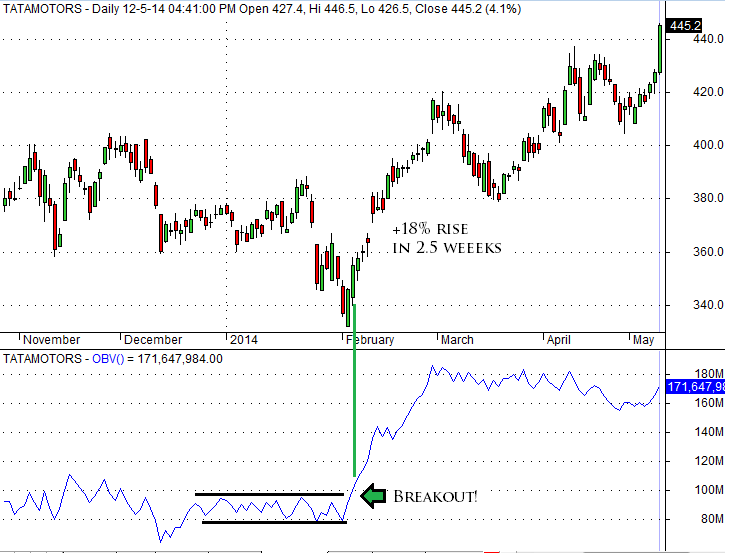
Advanced breakout
This takes place when both the price and volume of an asset move in the same direction but the OBV breaches the previous top while the price does not. In this case, the volume is too high compared to the magnitude of the price rise. We call this situation an advanced breakout.
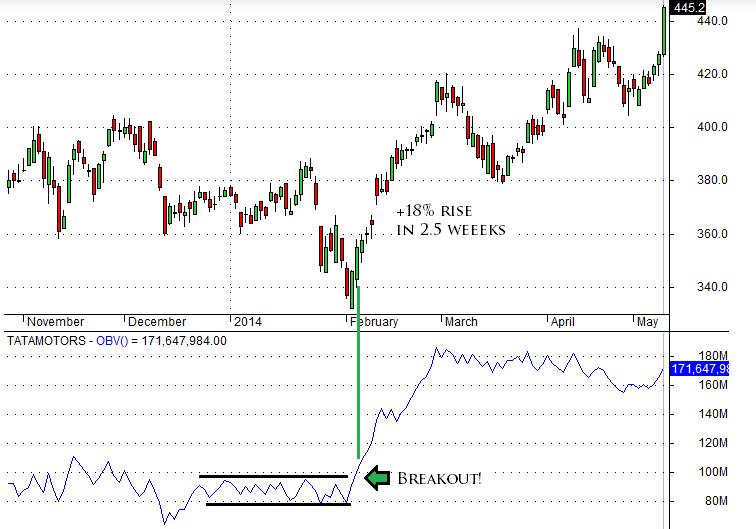
Source: Upstok
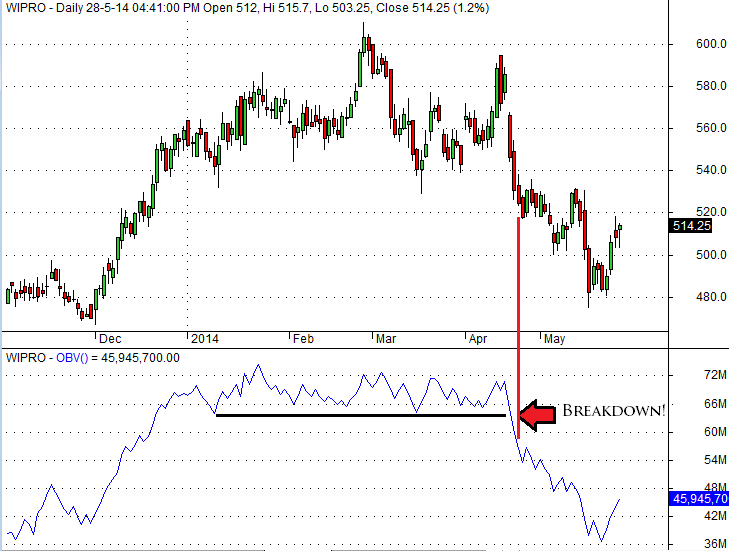
Advanced breakdown
An advanced breakdown occurs when the price and volume do not move in the same manner. This is the case when the OBV breaks the previous bottom while the price does not.

Source: Upstok
Conclusion
In short, the on-balance volume indicator is a measure of how much the volume is supporting the price of an asset at any given time. If the price of the asset is moving in the same direction as the volume, then the volume is in sync with it. However, if the price is moving in an opposite direction as the volume, there is divergence between the two which can indicate a potential trend reversal.
Author: Mashell C., Gate.io Researcher
This article represents only the views of the researcher and does not constitute any investment suggestions.
Gate.io reserves all rights to this article. Reposting of the article will be permitted provided Gate.io is referenced. In all cases, legal action will be taken due to copyright infringement.
🔑 Register an account with Gate.io
👨💼 Complete KYC within 24 hours
🎁 Claim Points Rewards
